

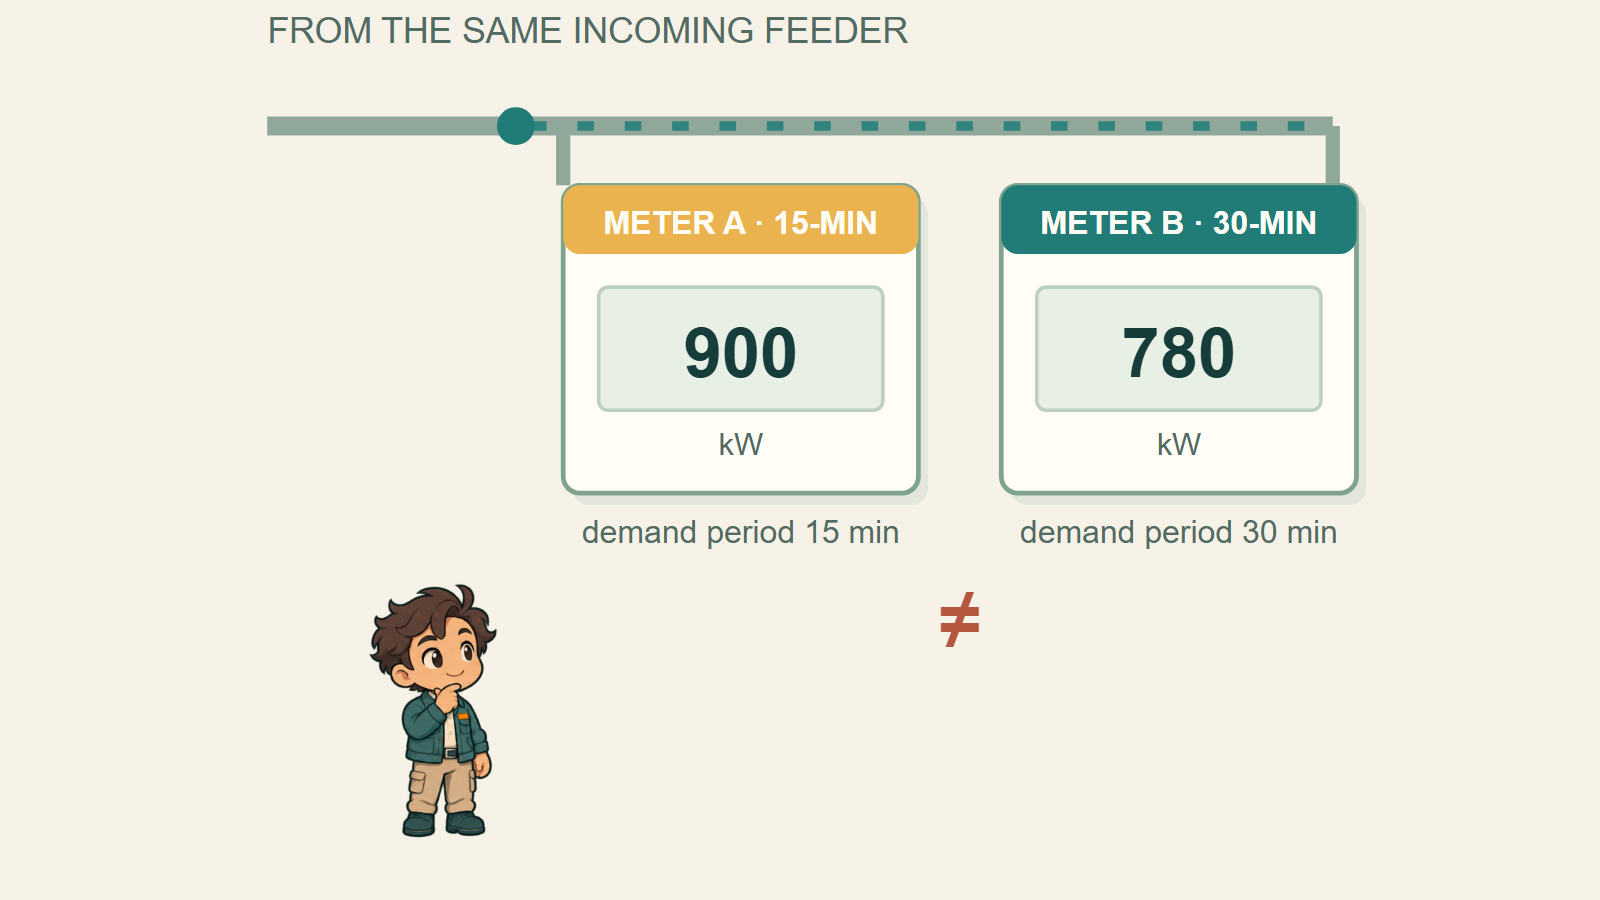
You have the meter’s interval data and the TNB bill. The question is not which number looks more reasonable. It is whether the two records can be compared at all. Three checks and one arithmetic step decide that, and the arithmetic is where most comparisons go wrong.
The arithmetic: kWh in, kW out
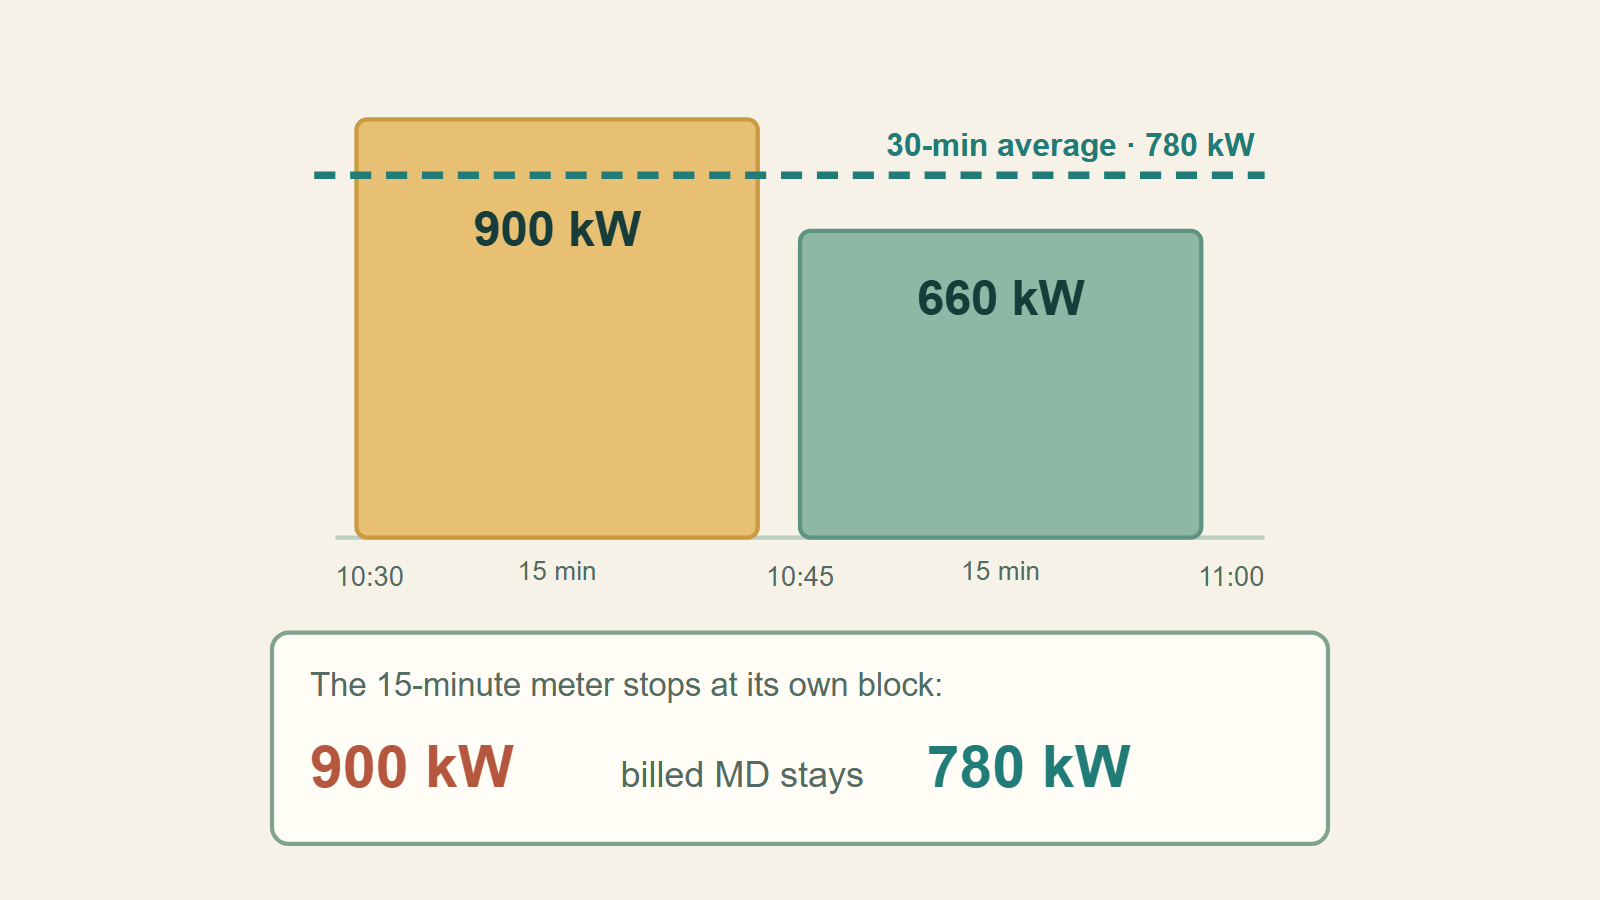
TNB defines Maximum Demand as twice the largest number of kilowatt-hours supplied during any consecutive thirty minutes in the month. For a half hour made of two aligned 15-minute intervals, the energy is the sum of the two, and the average power is that sum divided by 0.5 hours, which is the same as multiplying by 2. 1
| Interval | Energy in the interval | Average power |
|---|---|---|
| 10:30-10:45 | 225 kWh | 900 kW |
| 10:45-11:00 | 165 kWh | 660 kW |
| 10:30-11:00 (billing window) | 390 kWh | 780 kW |
A 15-minute reading of 900 kW therefore does not describe the billed demand. The billed quantity is built from energy over thirty minutes, and the two intervals together give 780 kW. Anyone who compares 900 with 780 without doing this step is comparing a quarter hour with a half hour.
What 15-minute data can prove, and what it cannot
If the meter’s intervals are aligned with the billing boundaries — normally on the hour and half hour — pairing consecutive intervals reproduces the highest aligned half hour exactly. That is a real result, and it is usually what a meter register shows when its demand period is set to 30 minutes.
The difficulty is the word “any”. TNB’s published definition refers to any consecutive thirty minutes, not only to a window that begins on the hour or half hour. A window starting at 10:37 takes seven minutes from one interval, all of the next, and eight minutes of the one after. Its energy can be higher than any aligned pair, because the highest thirty minutes do not have to respect the meter’s interval boundaries.
With 15-minute data you can bracket that window but not locate it: the rolling maximum is at least the block maximum and no more than the sum of the three overlapping intervals. Reproducing it needs 1-minute data or the meter’s own rolling demand register.
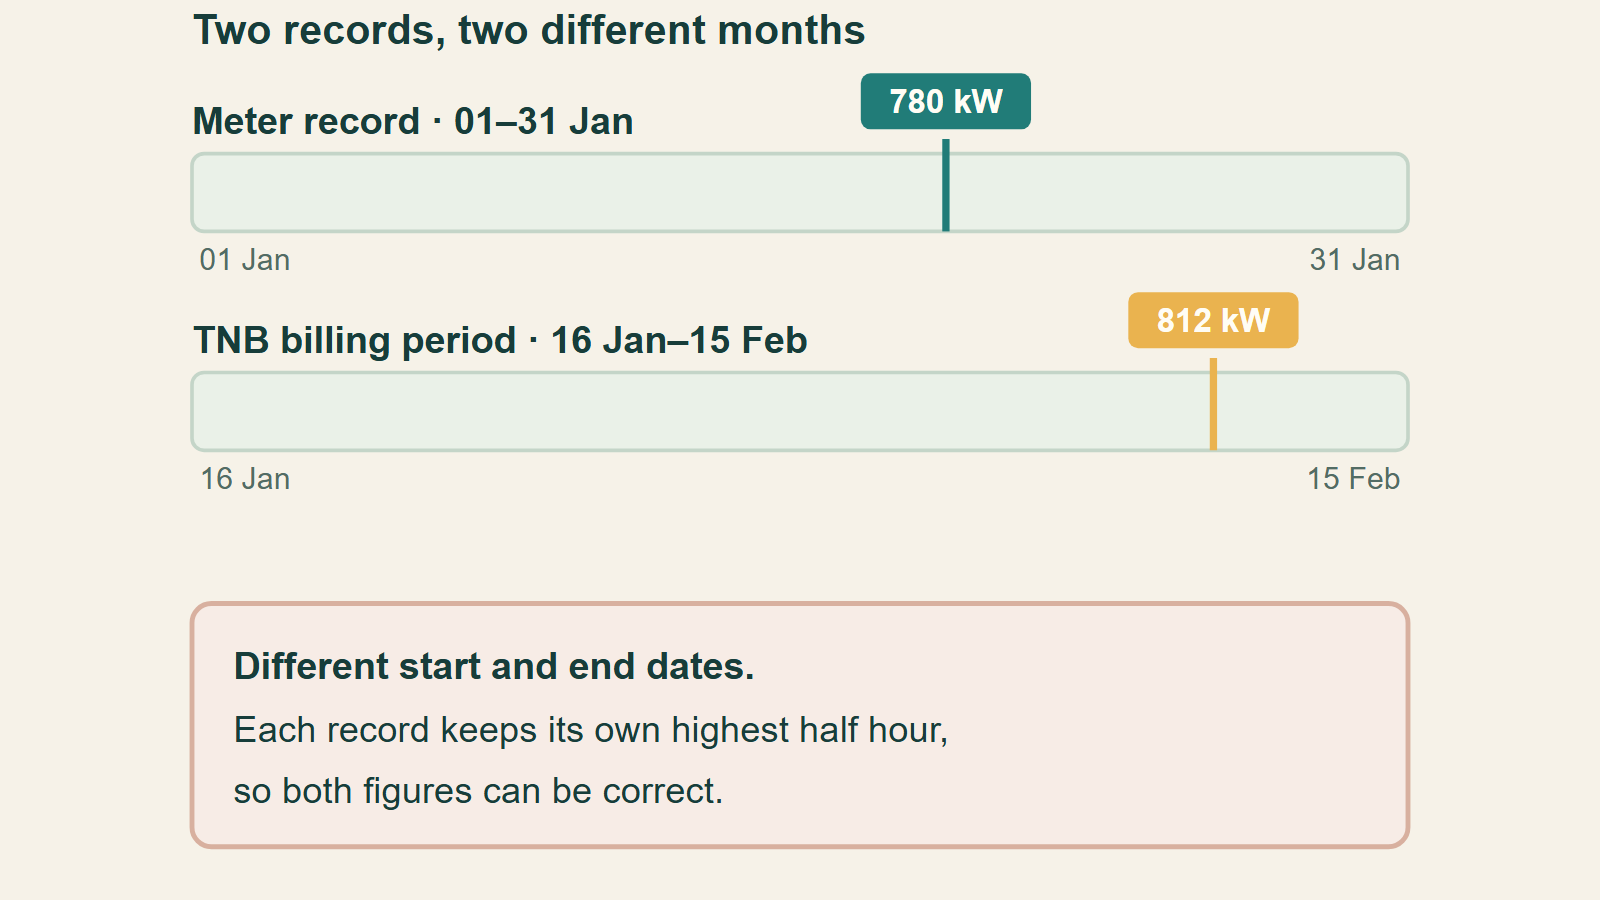
So separate the claims. “The highest aligned half hour in this record is 780 kW” is something the data proves. “The bill’s 812 kW is wrong” is not, until the period, the clock and the multiplier have been checked as well.
Three settings that break the comparison
Billing dates. Meter demand registers reset on their own schedule, often on the first day of the calendar month. A TNB bill covers a reading cycle that may start on a different date. Two records that cover different days cannot be expected to hold the same maximum, and each can be correct on its own period.
CT and VT multiplier. If the meter stores secondary-side values, the primary value is the secondary value multiplied by the CT ratio, and by the VT ratio where voltage transformers are used. A 400/5 CT entered as 500/5 shows 1.25 times the true power; a 500/5 CT entered as 400/5 shows 0.8 times. This error scales every interval equally, so it survives every date and window correction.
Clock. Interval timestamps come from the meter clock. A drifted clock shifts every interval relative to the bill, which changes which half hour is highest near a peak. Malaysia does not observe daylight saving, so the usual seasonal offset does not apply here; an unsynchronised meter clock still does.
The worksheet
Record six fields when the meter is commissioned, because they are hard to recover later:
| Field | Where to read it | Why it matters |
|---|---|---|
| Demand period | Meter demand menu | 15 or 30 minutes changes the number |
| Window type | Manual or parameter list | Block or rolling |
| Reset date | Meter clock and register | Must match the billing period |
| CT ratio | CT nameplate against meter setting | Scales every value |
| VT ratio, if used | Nameplate against meter setting | Medium-voltage metering only |
| Clock source | Meter, NTP or manual | Shifts interval boundaries |
The check itself needs four columns: interval start, kWh, paired 30-minute kWh, and kW, with the highest pair flagged. One page of that table settles most arguments without new equipment.
What counts as a match
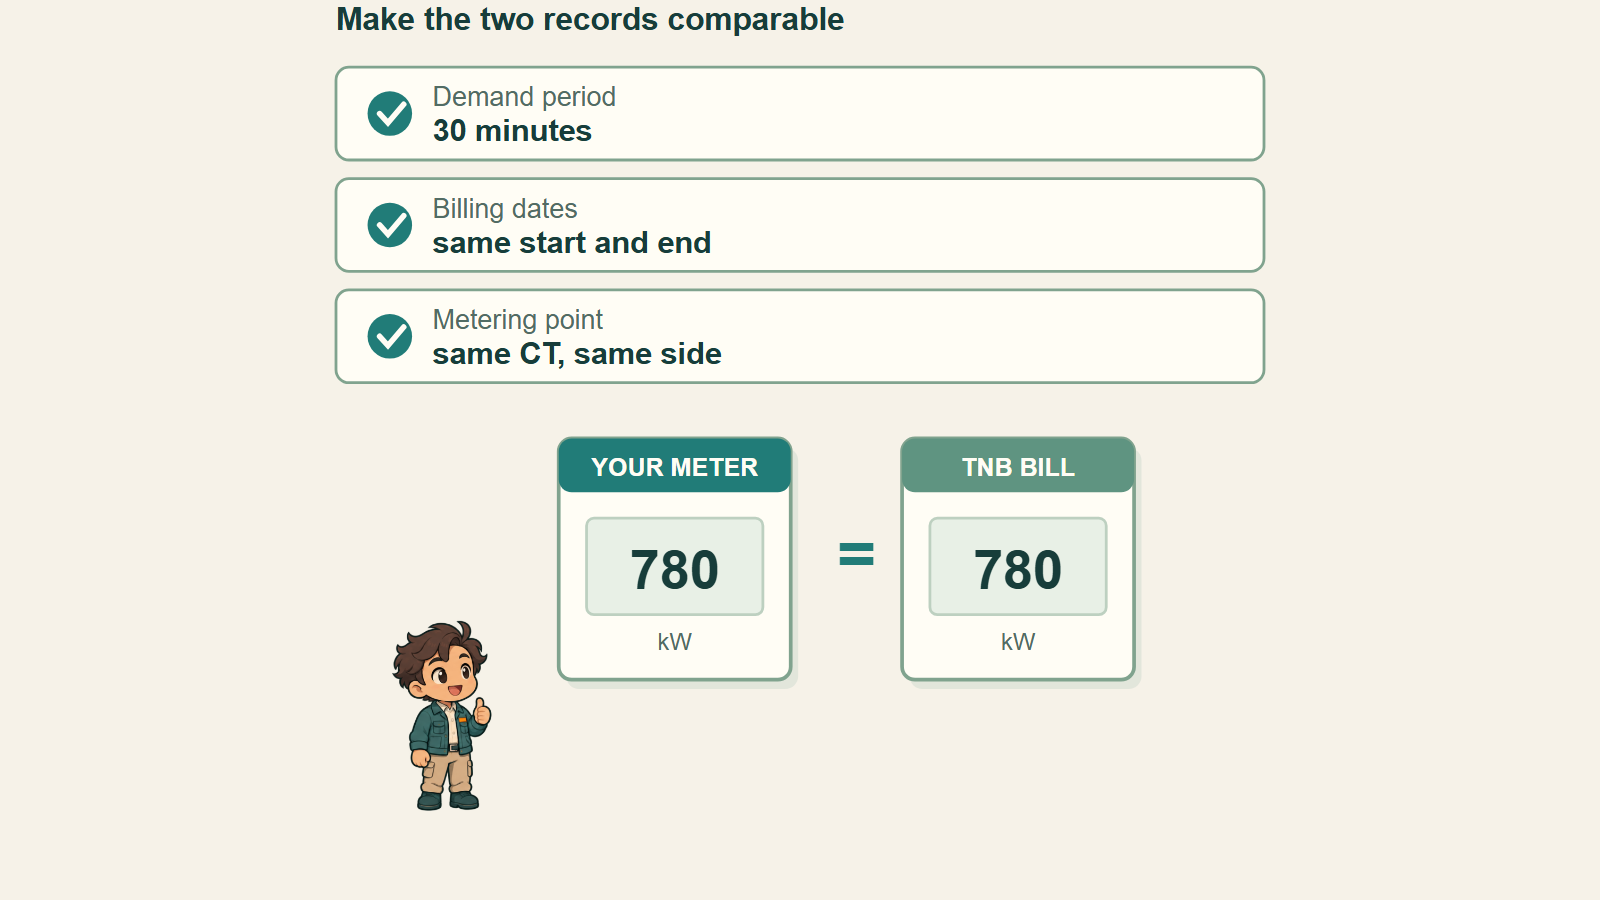
This is engineering judgement, not a standard clause: the block maximum should reproduce the bill within rounding and interval quantisation. A difference of a few tenths of a percent is noise. A difference of one or two percent of MD is worth investigating, and anything larger points to a multiplier, a boundary or a period error rather than to measurement uncertainty.
If the block maximum matches and the bill is still higher, the remaining explanation is the rolling window — the bill found thirty minutes that the aligned pairs could not. That is a finding, not a fault, and it should be written down as one.
What to send for a check
- A complete bill: tariff category, billing dates, MD and charge units.
- Interval data for the same period, with the interval length stated.
- The six handover fields above, or a photo of the meter’s demand settings.
- The single-line diagram and CT ratio.
For Malaysia projects, send these to Jack Ren, Sales Engineer, Acrel Malaysia: jack@acrel-electric.com or WhatsApp +86 18702113209. Website: https://www.acrel.my. The first pass is arithmetic and settings, not a site visit.
The numbers in this article are an illustrative example and not a site record.
Sources
- TNB Maximum Demand
- Acrel ADW300A manual V1.3 (EN), section 5.4 – demand period and slip time. Downloaded copy held in the project reference folder.
- TNB tariff structure and calculator
Sources checked 5 November 2026. Figures are illustrative, not a project result.
Post time: Nov-06-2026


