

At 2:30 pm, production is running, the cooling load is rising and a second compressor starts. Which loads stay high together long enough to set the factory’s demand peak?

A practical monitoring layout
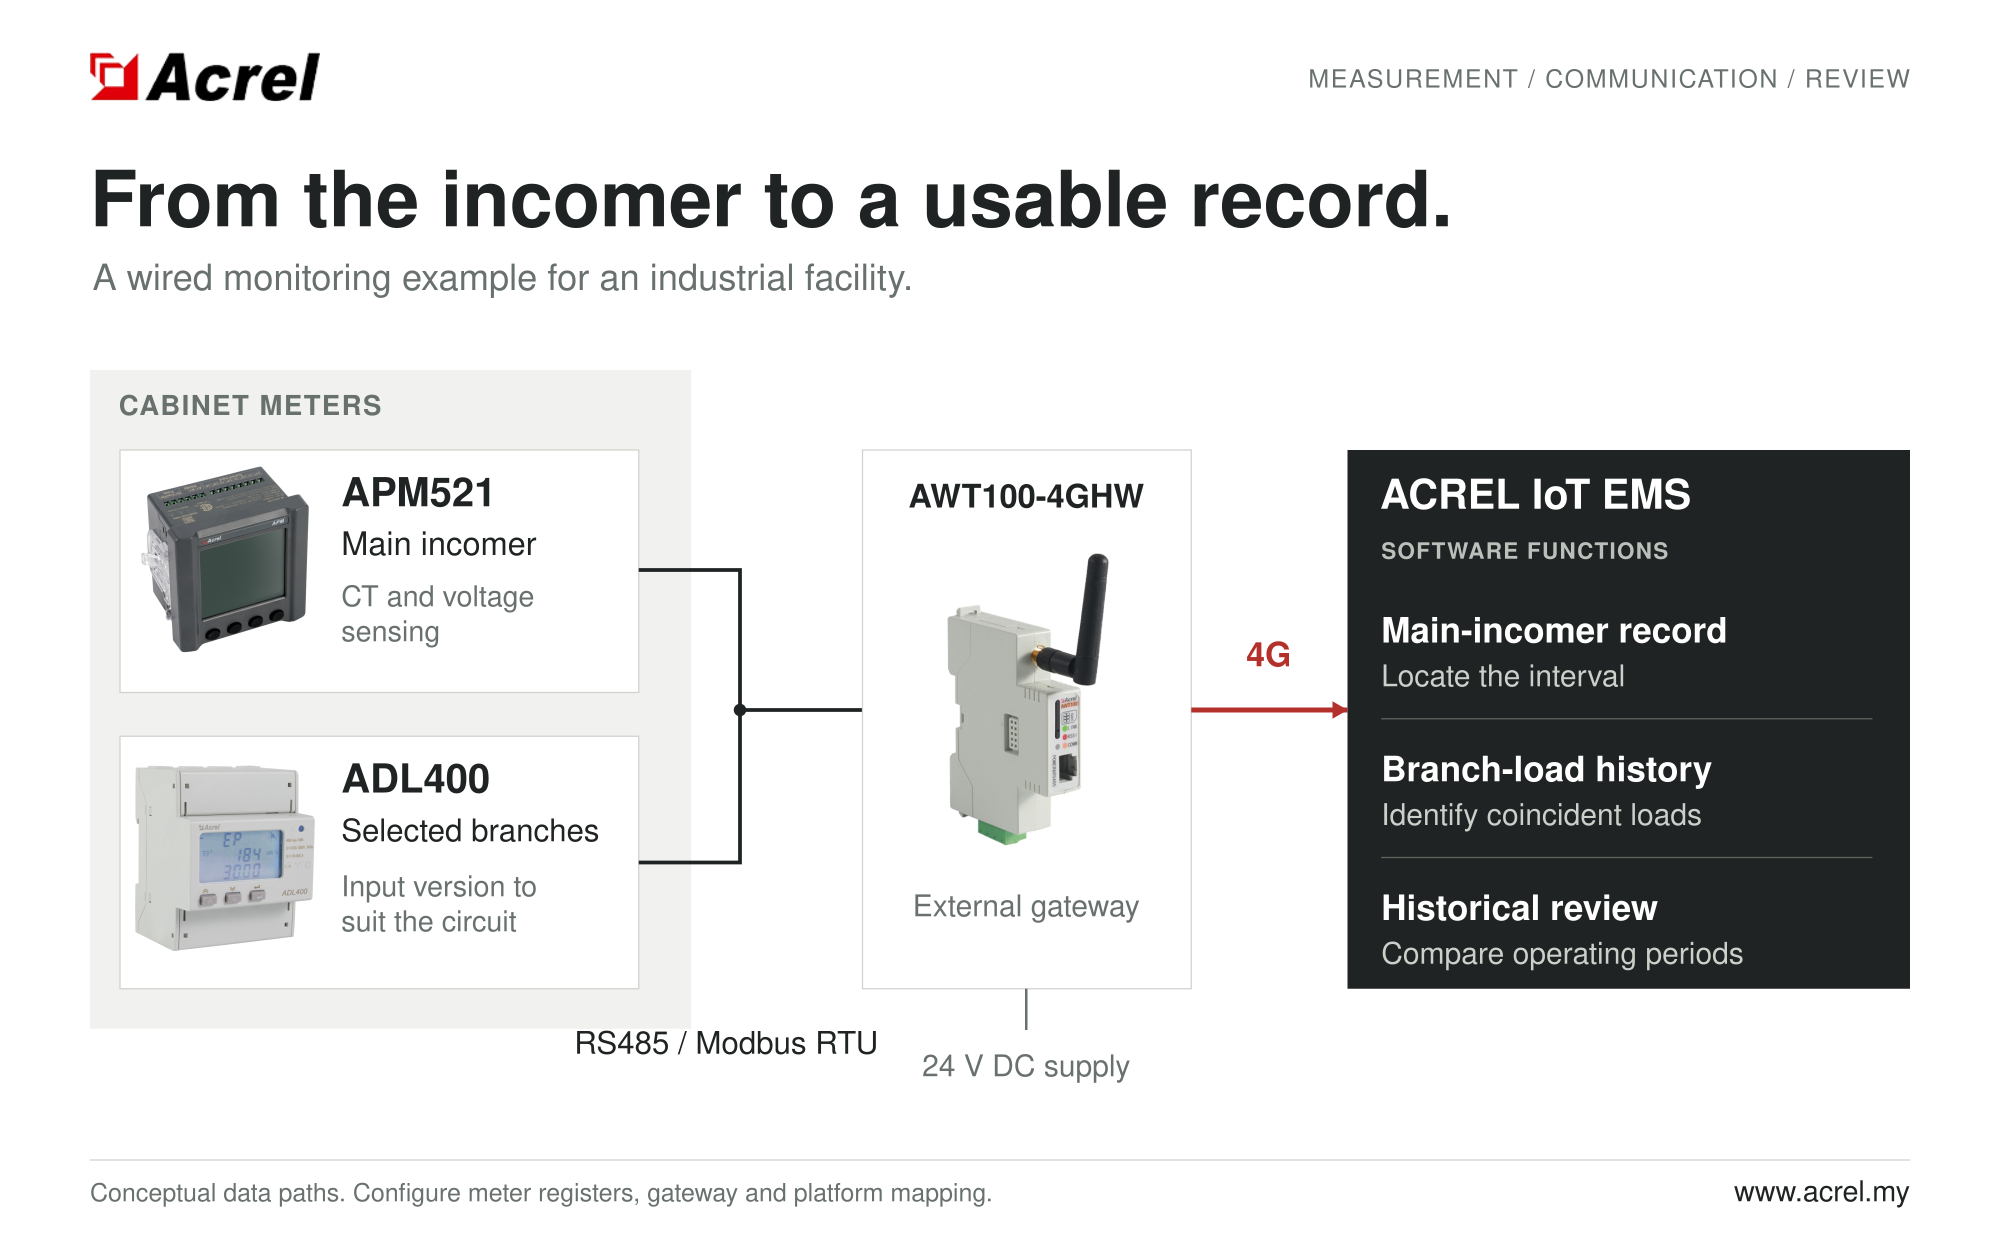
Monitor the main incomer with APM521, then add meters on selected branches. For a wired installation, an external gateway connects RS485 meters to Acrel IoT EMS. The diagram shows one possible data path.
Choose the branch meters
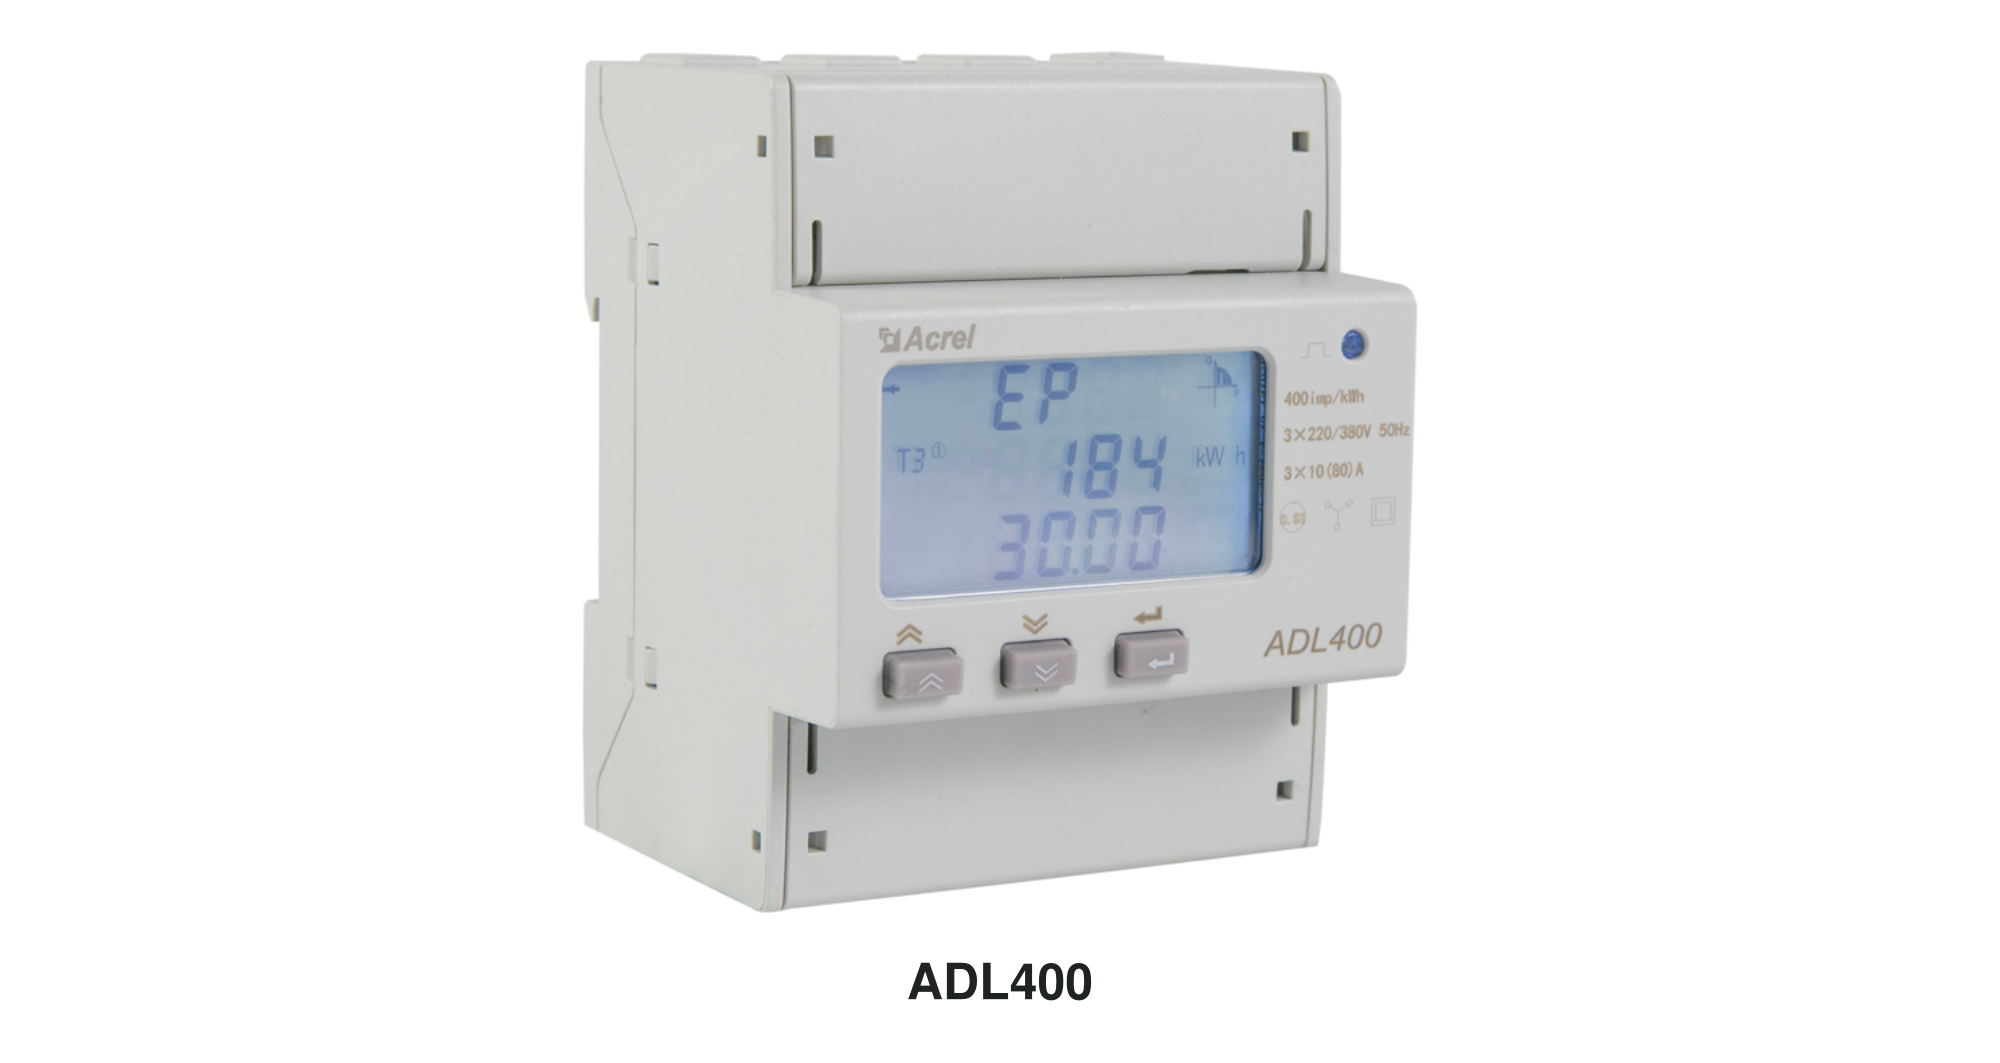
Regular ADL400 meters suit selected three-phase circuits with practical RS485 cabling. Match the current-input version to the circuit. For a distant compressor room, consider a suitably configured ADW300A wireless version after checking coverage and platform compatibility.
ADL400 direct-input version shown.
Connect the field data
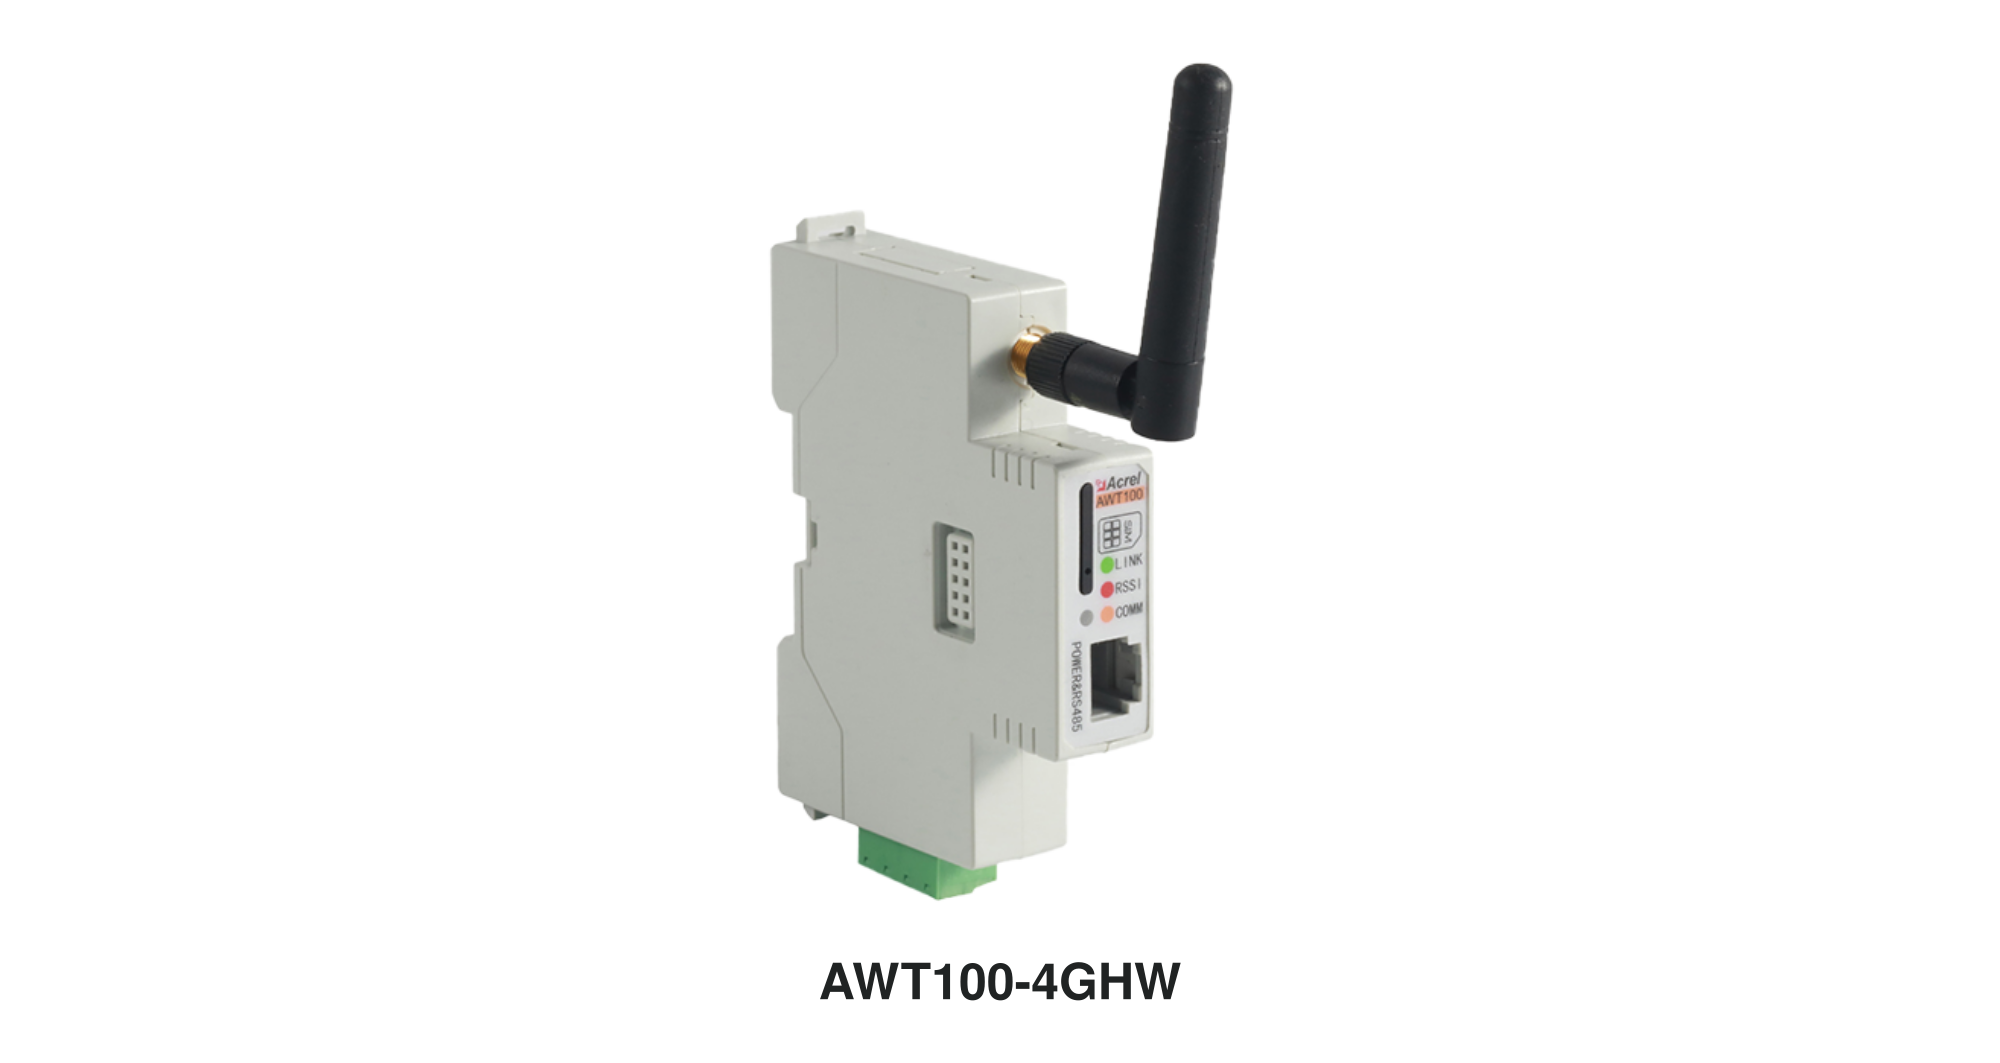
AWT100-4GHW provides an RS485-to-4G path. Configure its power supply, meter registers and platform connection for the project.
Look at the same half-hour
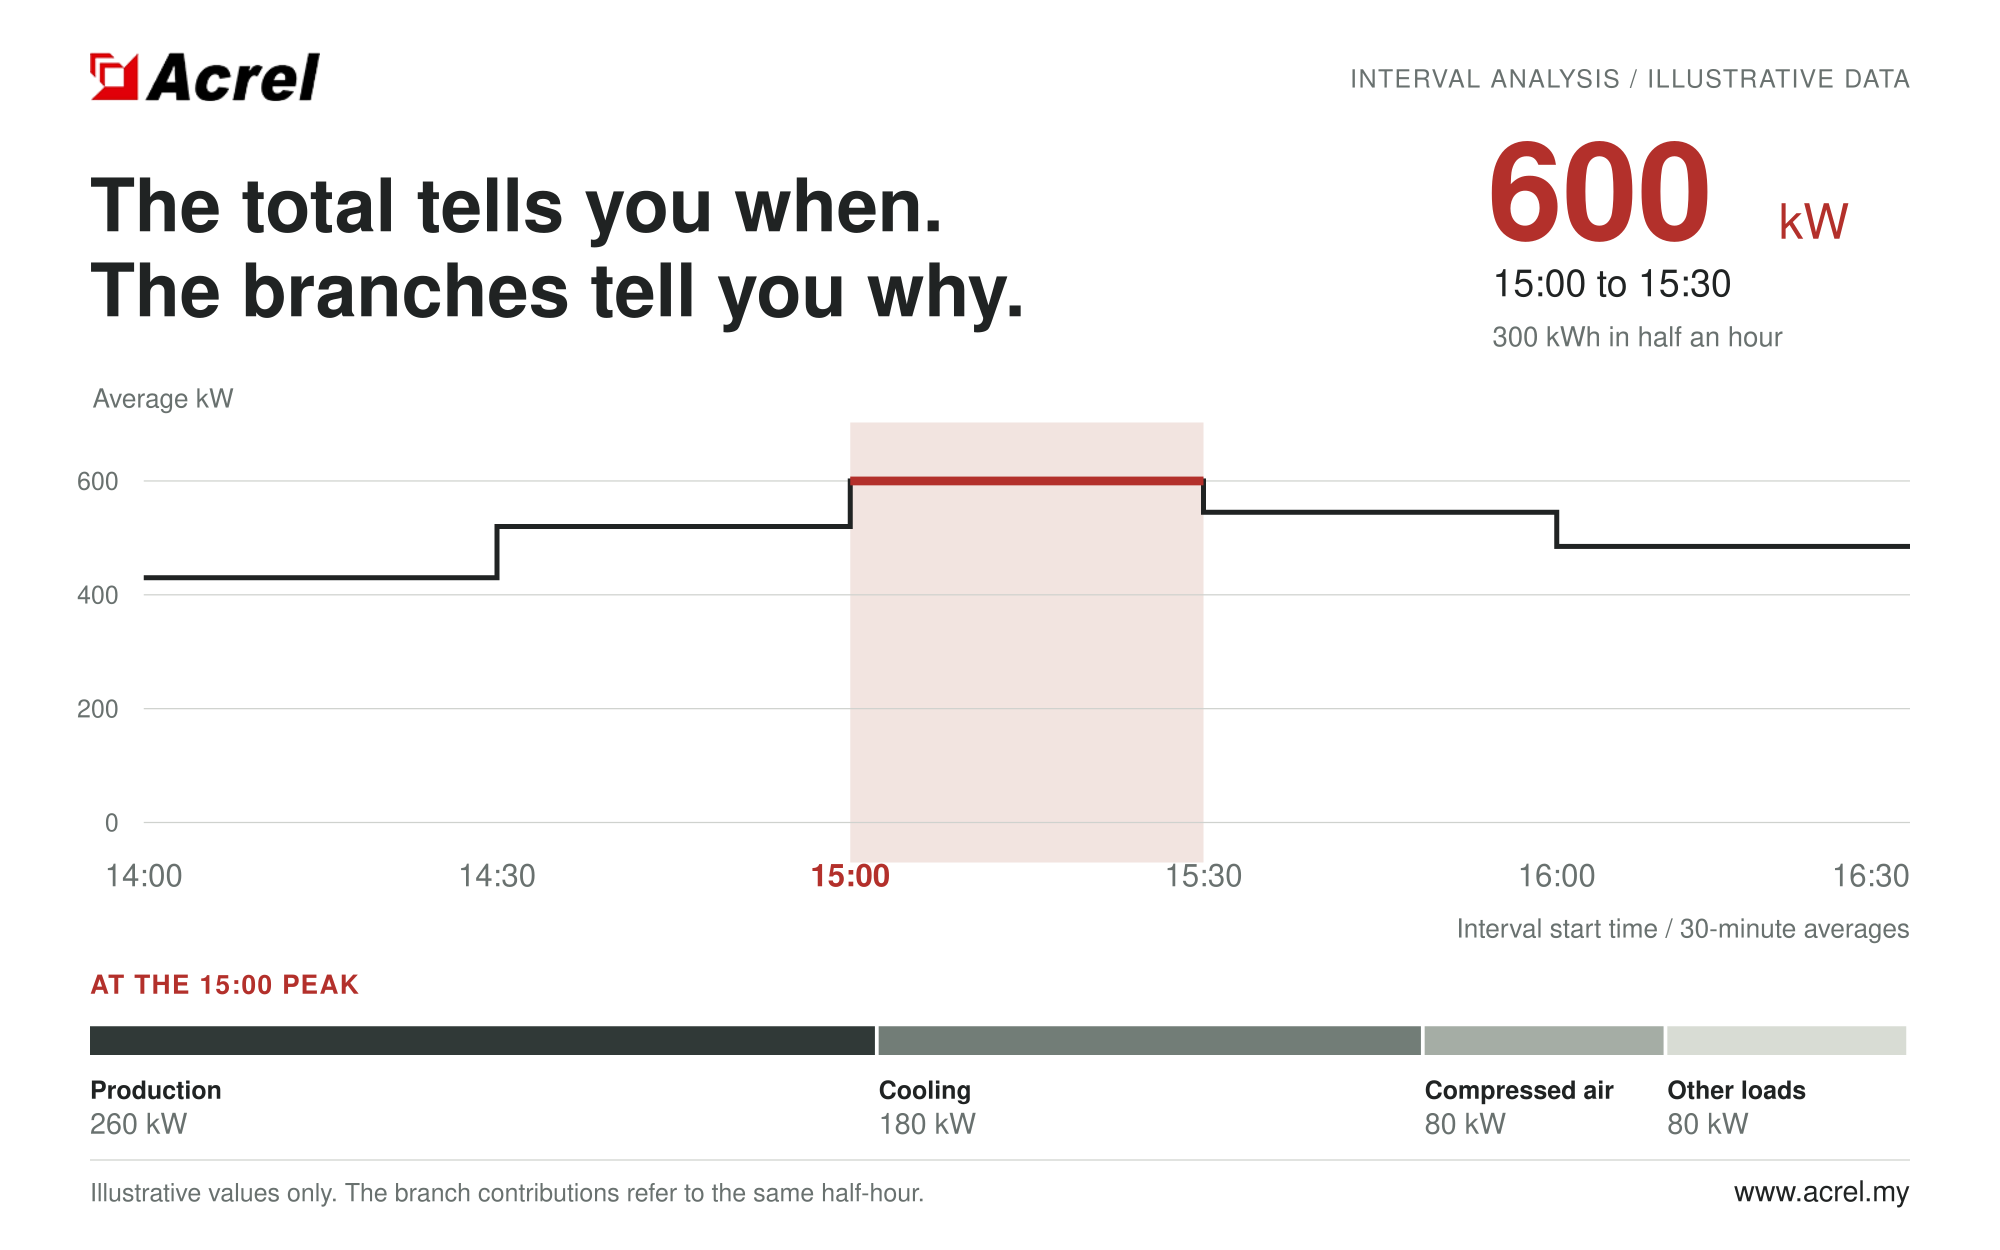
In this illustrative example, the site averages 600 kW from 3:00 to 3:30 pm. Compare each load during that interval. Separate branch monthly maxima should not be added together.
Review the event in Acrel IoT EMS
Use the historical records to review compressor sequencing, cooling schedules and batch timing with the operations team. Align clocks, demand settings and the measurement boundary before comparing internal readings with the TNB meter.
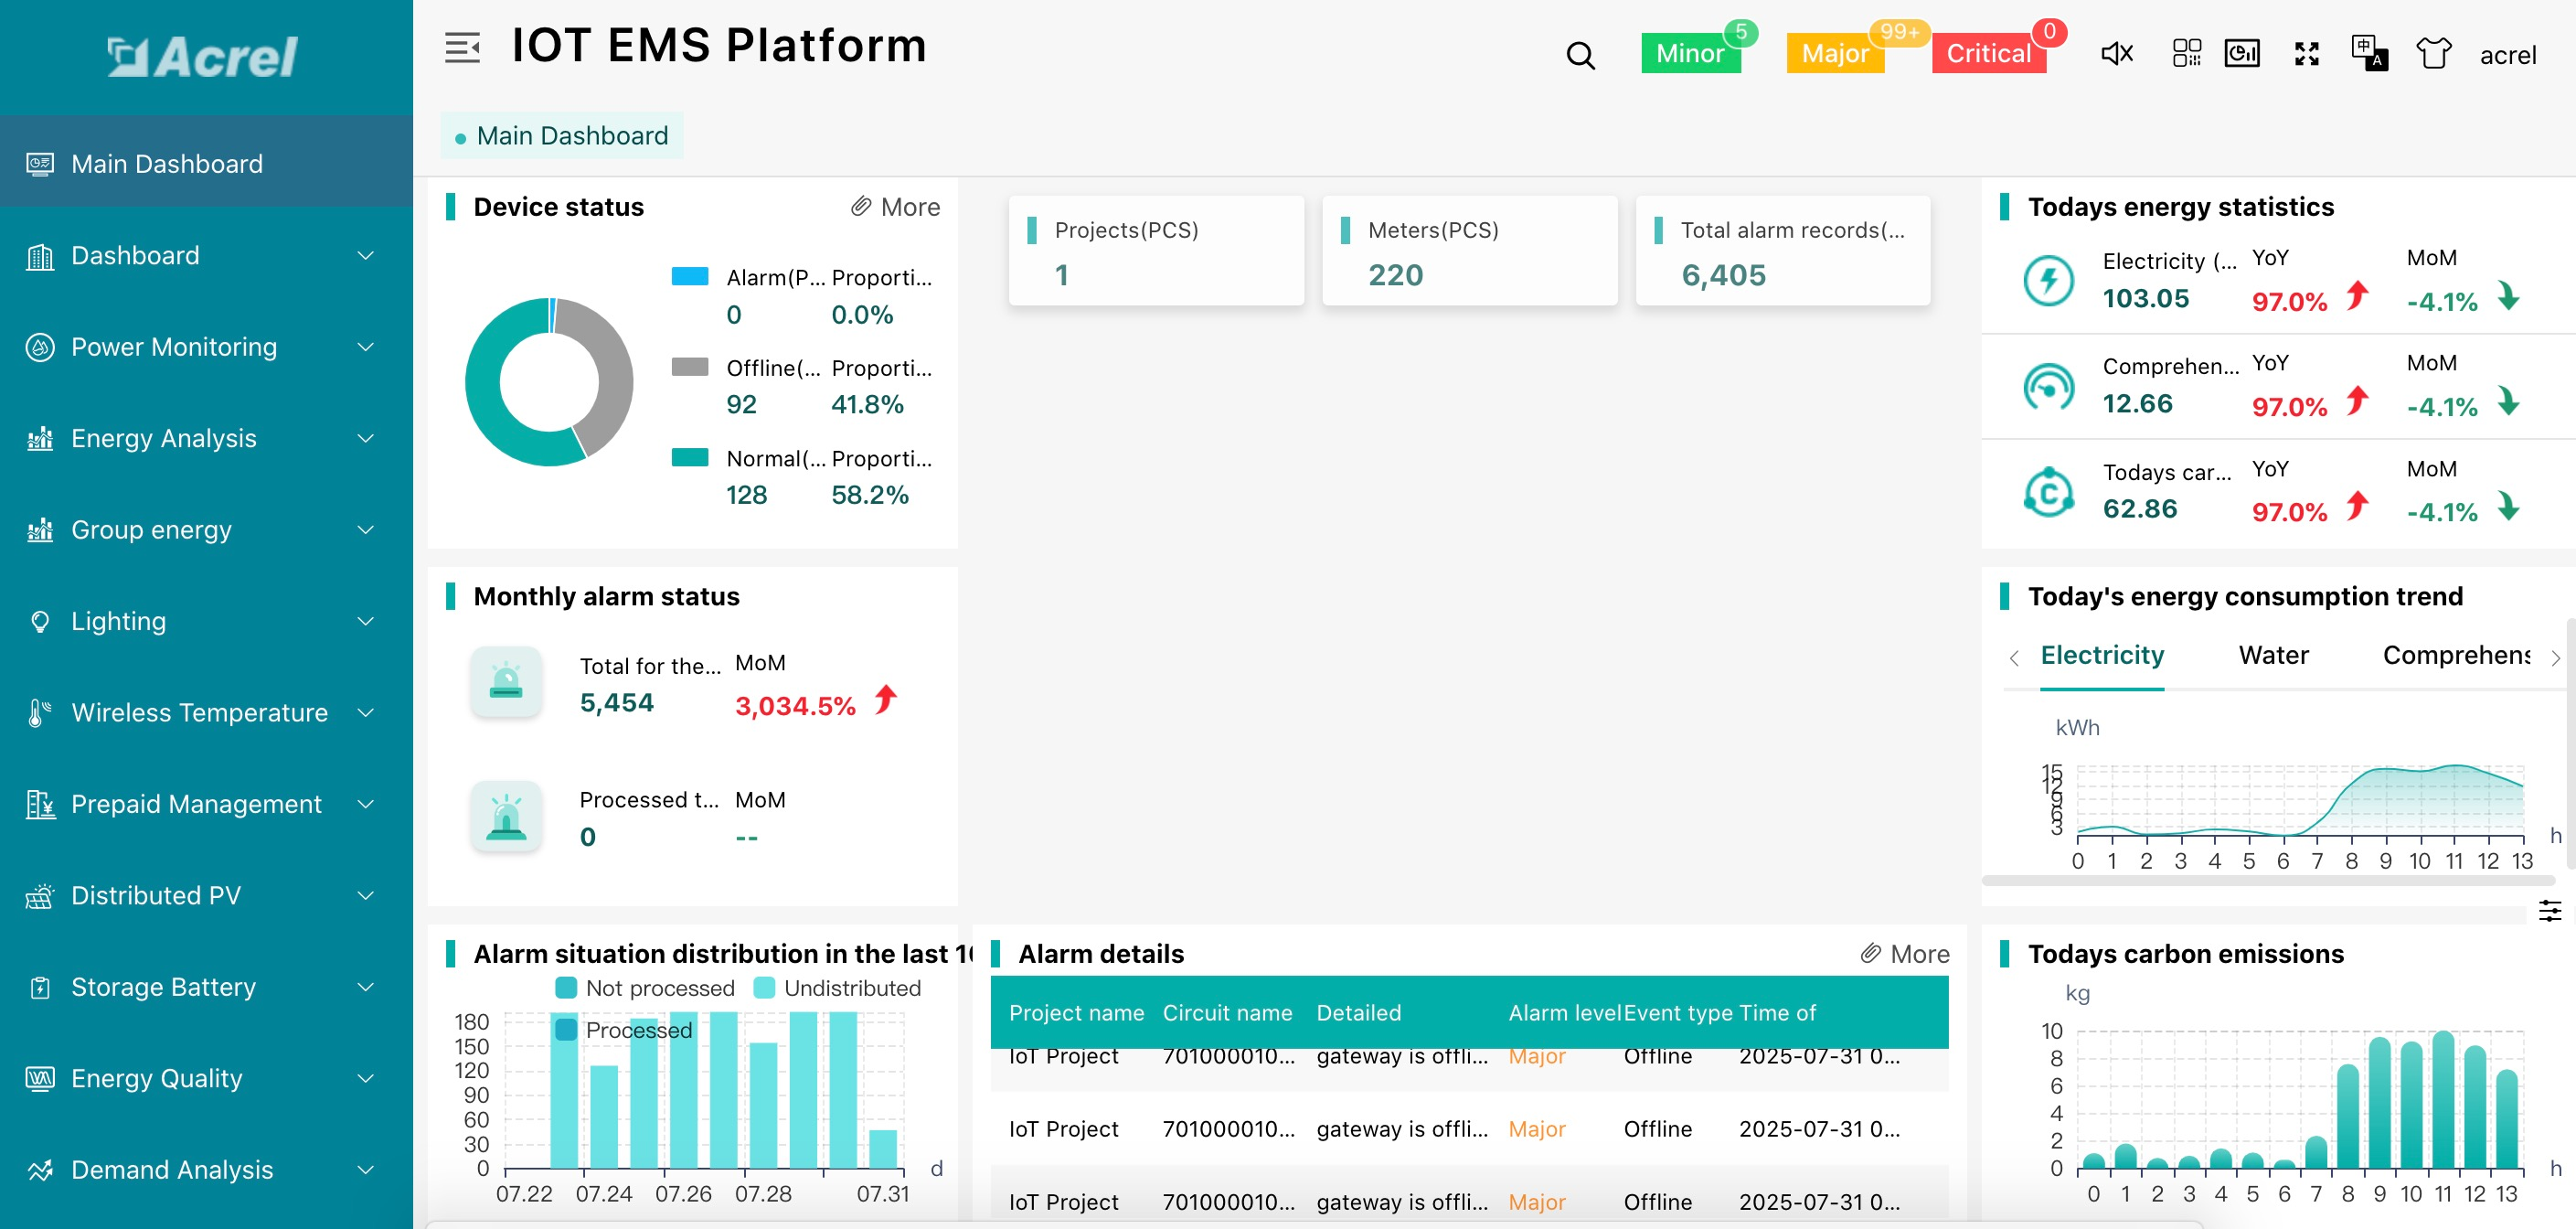
Official platform example; displayed values are demo data.
Share your TNB bill and single-line diagram with Acrel to discuss the measuring points your facility needs.
Post time: Sep-15-2026


