

ob_start_detected
head_banner_news

Track Demand Peaks Before They Become a Cost Surprise


Demand management · Malaysia

On a Malaysian large-supply tariff, maximum demand is billed on a 30-minute rolling window, and the time-of-use peak band runs from 14:00 to 22:00. One compressor start inside that eight-hour band can set the demand charge for the entire month. The bill that reports it reaches you about a month later — so a maximum demand figure on a bill is not a warning. It is a receipt.
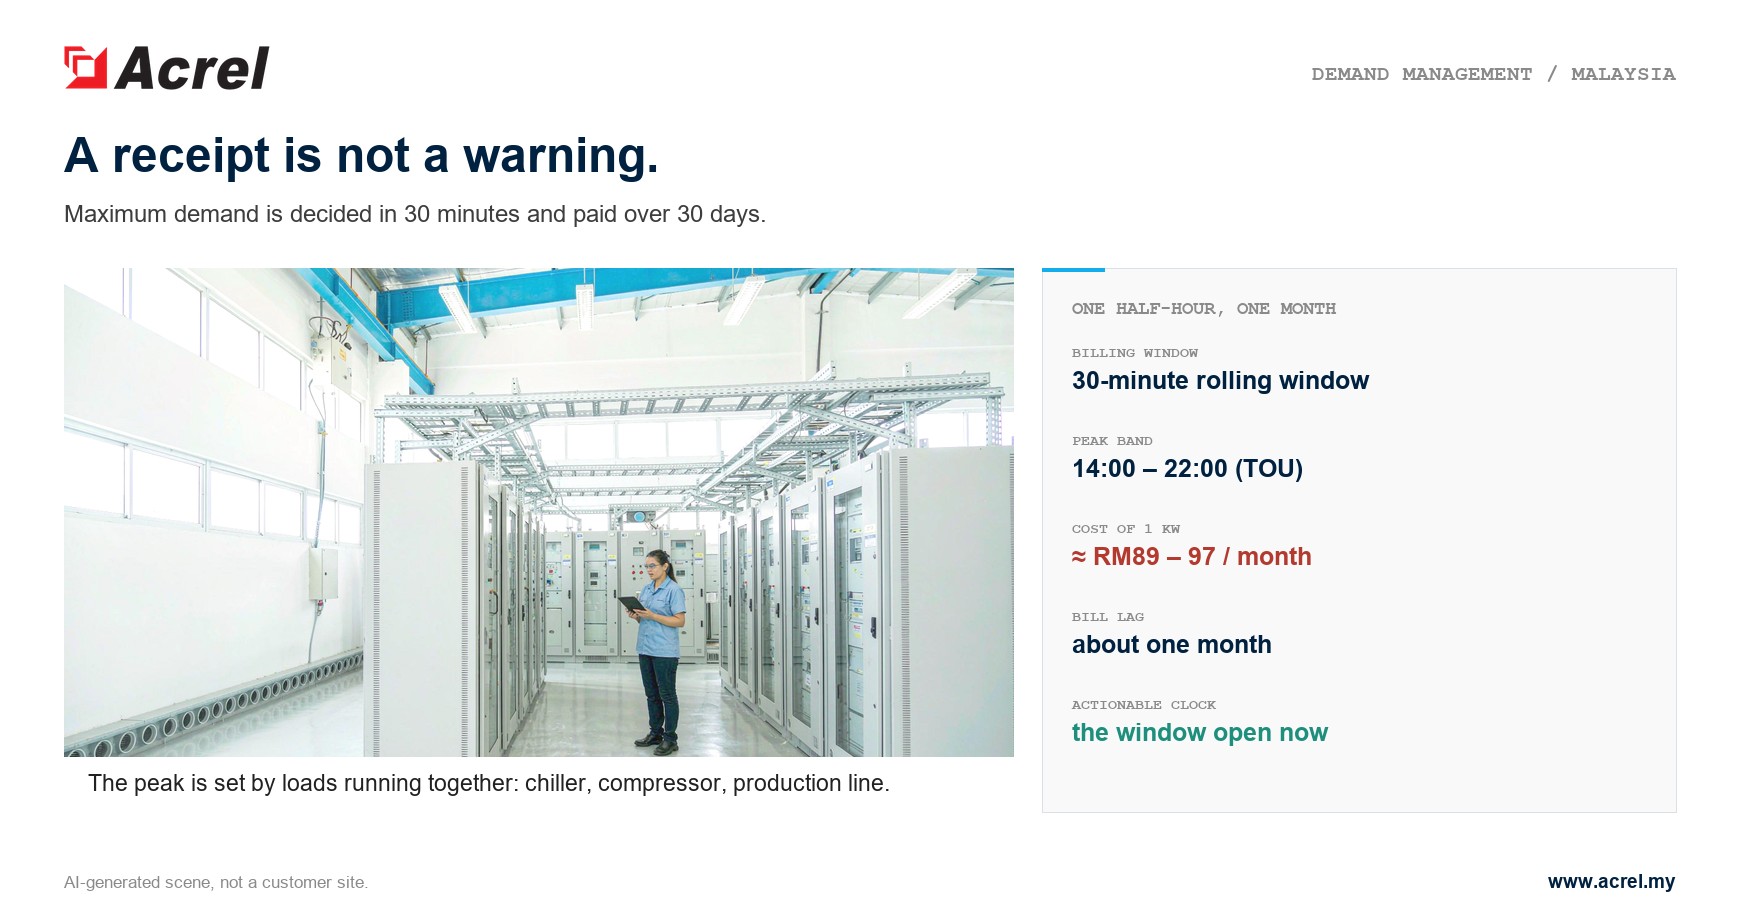
DP-01-peak
01 · The charge

A receipt is not a warning

A demand charge is unusual among operating costs, because it is decided in about thirty minutes and paid over thirty days.

That is the whole problem. By the time the figure is printed, the window that produced it has closed. Nobody was in the plant at 15:47 on a Tuesday, no alarm sounded, and the load that lifted the charge was a machine that had been running perfectly normally all month.

Facility teams usually respond to this by reviewing bills. That answers the wrong question. A bill tells you what the peak was, never what was about to happen — and the difference between those two questions is the entire cost of the charge.

The charge itself has become harder to ignore. Under TNB’s RP4 tariff structure, in force from 1 July 2025, maximum demand is no longer a single line. For a medium-voltage account it is billed as a Capacity Charge plus a Network Charge, and the two together land near RM89.27 per kW on the general scheme or RM97.06 per kW on time-of-use — every month, for the same peak.

Billing window
30-minute rolling
Highest average demand inside the window
Peak band
14:00 – 22:00
Time-of-use peak period under the tariff
Bill lag
about one month
Between the peak and the figure you see
Cost of one kW
≈ RM89 – 97
Per kW per month, medium voltage under RP4

Take one number as a yardstick. Shave 50 kW off the monthly peak on a time-of-use account and the demand charge falls by roughly RM4,850 a month — about RM58,000 a year, with no change to how much energy the site consumes. That is the arithmetic that makes a warning worth wiring.
DP-02-clocks
02 · Three clocks

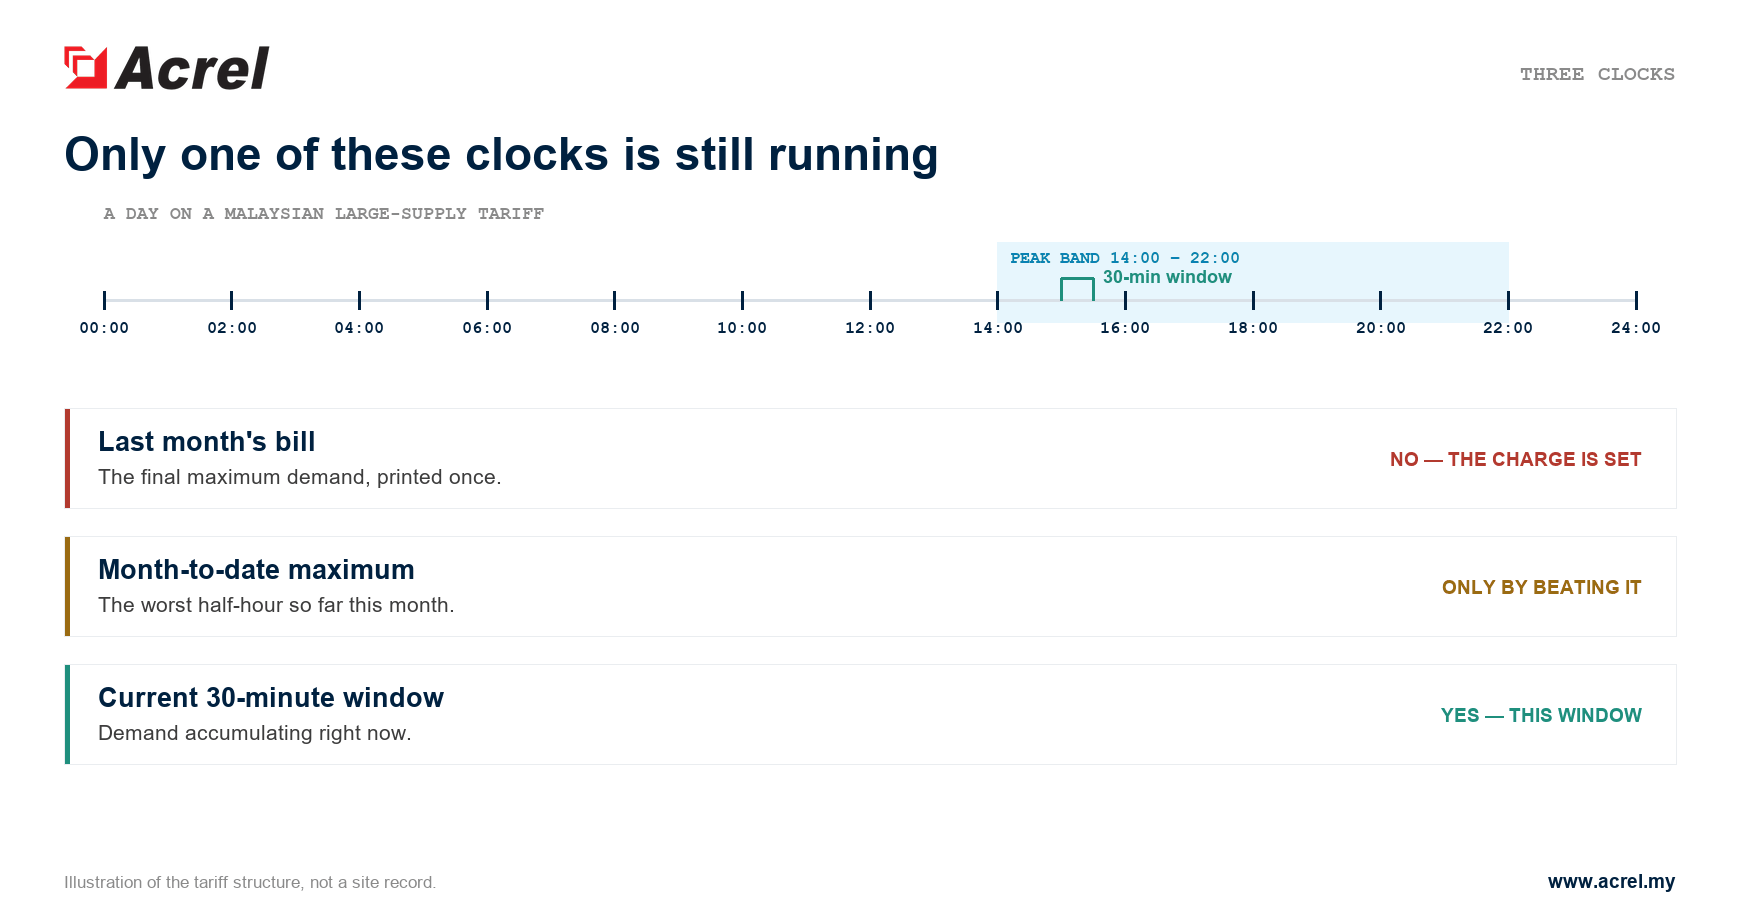
Three clocks, and only one of them is still running

Demand is reported on three different clocks at once, and they do not have the same usefulness.

Clock
What it tells you
Can you still act on it
Last month’s bill
The final maximum demand, printed once
No — the charge is set
Month-to-date maximum
The worst half-hour so far this month
Only by beating it
Current 30-minute window
Demand accumulating right now
Yes — this window

The third row is the only one worth wiring an alarm to. Everything a facility does about demand — staggering starts, rotating chillers, moving a flexible load out of the peak band — only works while the window is still open. After it closes, the number is a fact.

We have covered how the 30-minute window becomes the charge on a TNB bill and how to lay out a monitoring architecture in two earlier notes. This one is about the part those two could not cover: what happens while the window is still open.

So the design question changes. It is no longer how to read the bill better. It is how to see a peak forming, while it is still forming.
DP-03-trend
03 · Monitoring point

From a reading to a warning

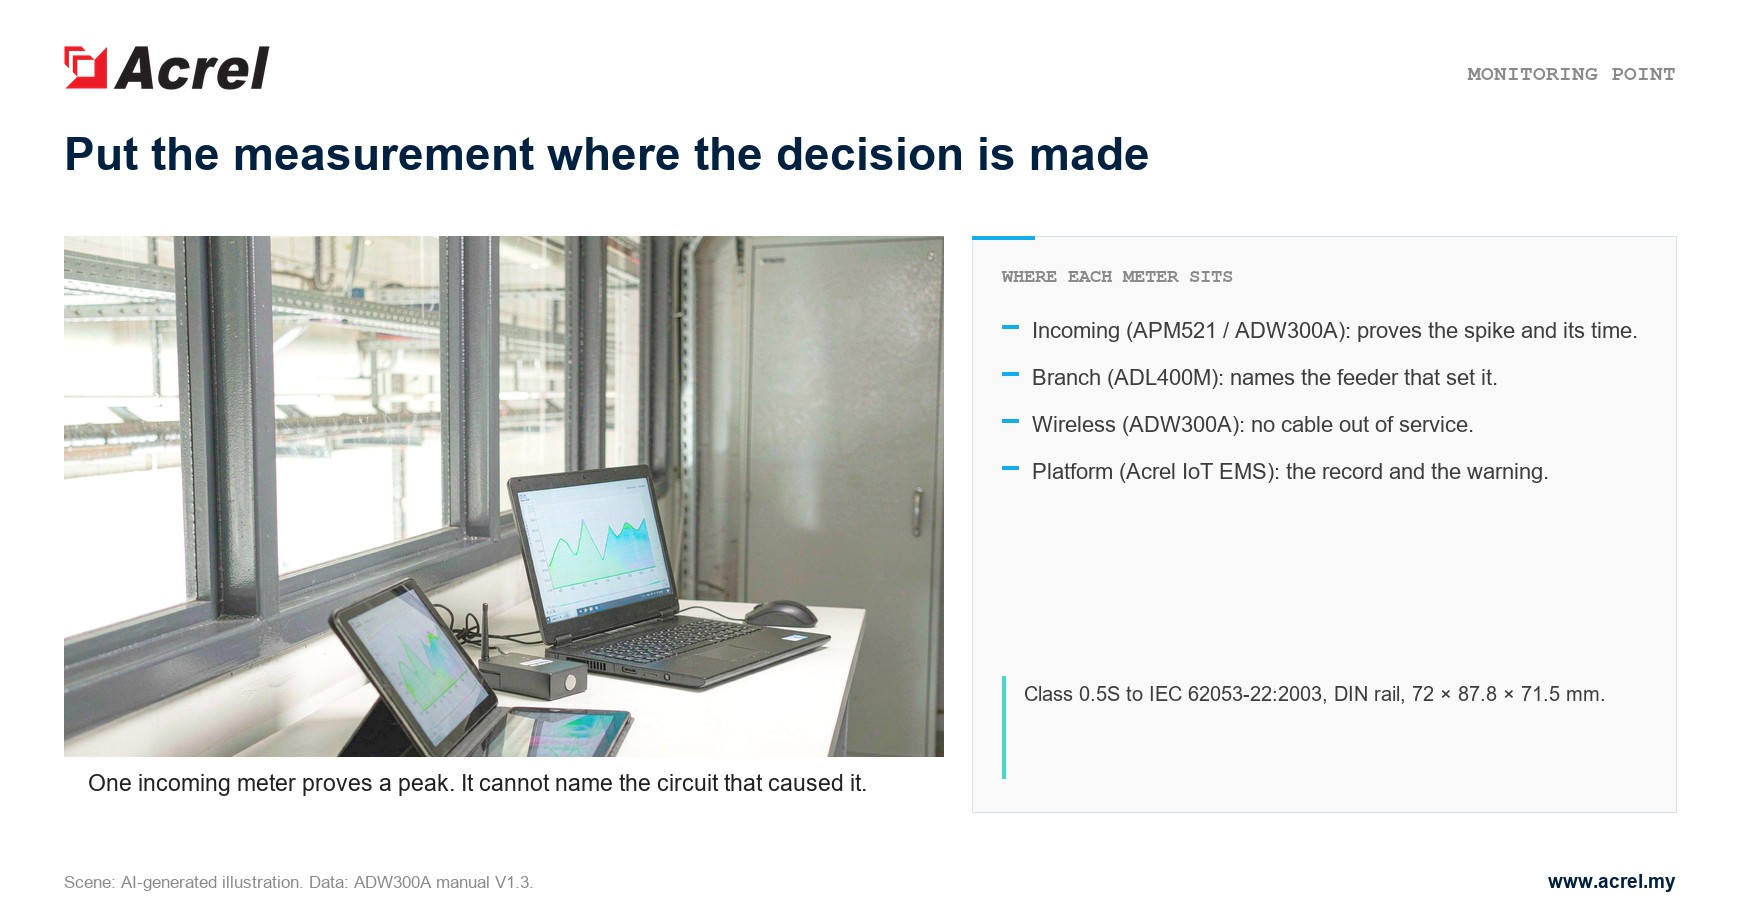
An incoming meter can prove a spike happened. It cannot say which circuit caused it, and by the time the reading is looked at, the window is closed. Sub-metering moves the measurement to the circuits that actually set the peak.

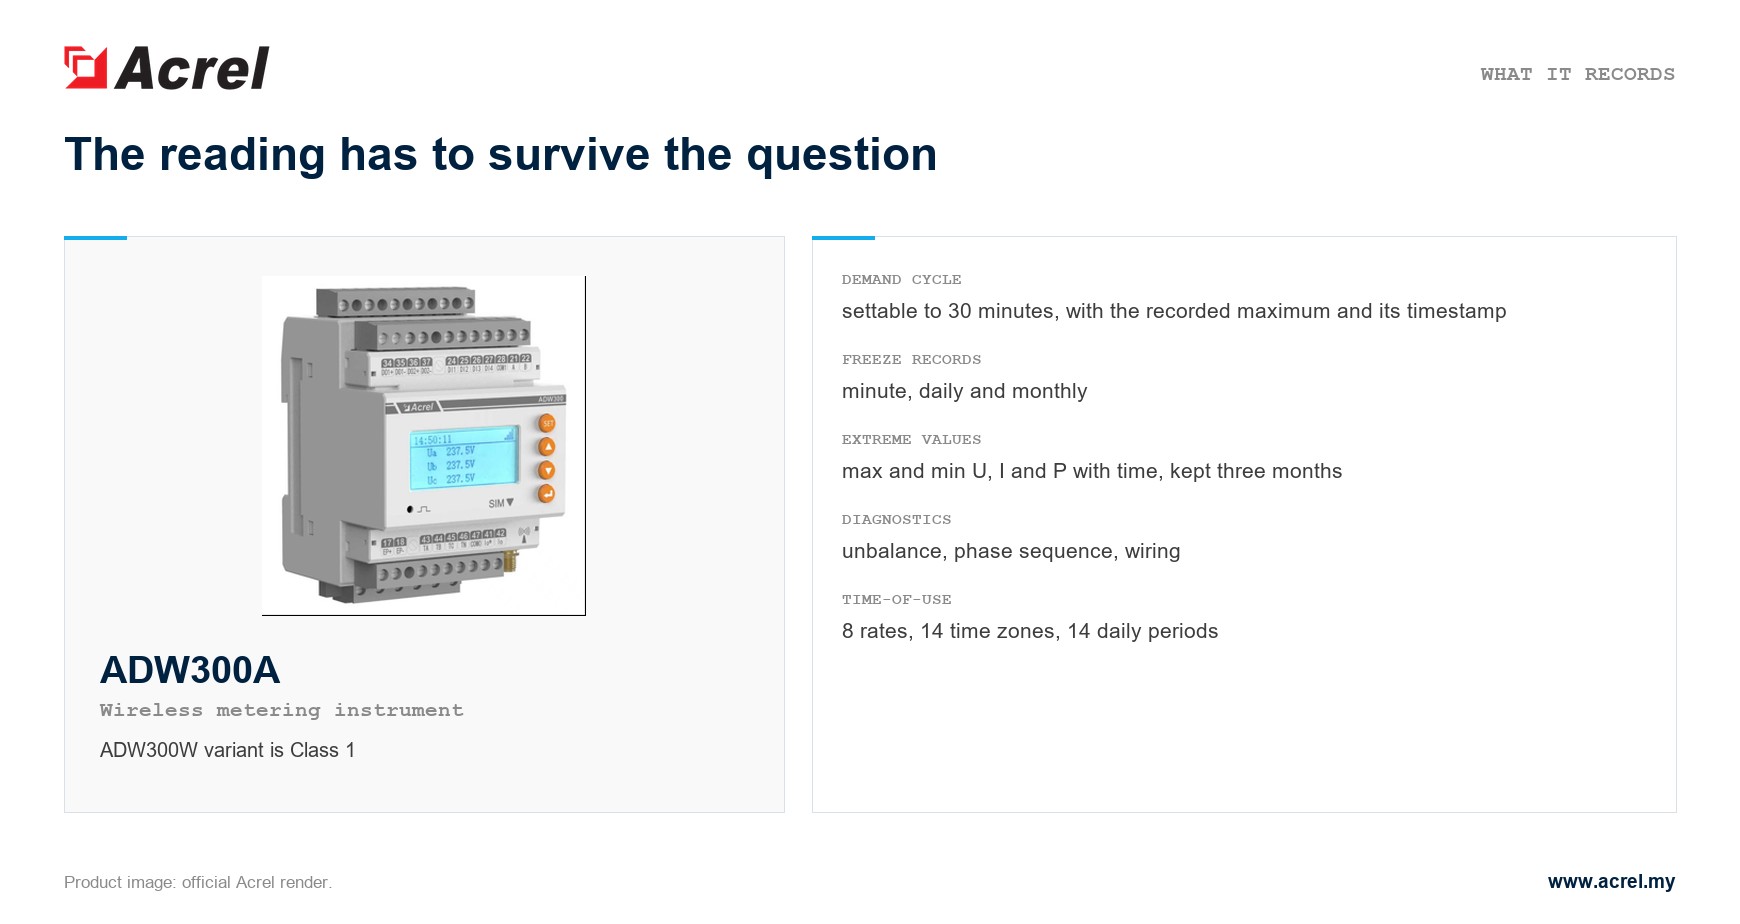
The ADW300A wireless metering instrument is built for that position: three-phase measurement in a DIN-rail case, external split-core CTs so no cable has to come out of service, and a demand record the operations team can act on the same afternoon.

Accuracy
Class 0.5S
ADW300A, to IEC 62053-22:2003; ADW300W is Class 1
Data out
RS485 · 923 MHz
Modbus-RTU, plus 4G, Wi-Fi, NB-IoT or LoRaWAN
Extreme record
3 months
Max and min U, I and P, each with its timestamp
Signals
4DI / 2DO
Plus 4-channel temperature and 1 residual-current channel
Recorded at the meter
Demand cycle settable to 30 minutes, with real-time demand and the recorded maximum stored together with the time it occurred.
Freeze records
Minute, daily and monthly freeze, so the same window can be compared across shifts, days and tariff periods without re-deriving it.
Diagnostics
Voltage and current unbalance, phase-sequence diagnosis and wiring diagnosis, so reversed CT polarity is found before the data is used.
Time-of-use energy
8 rates, 14 time zones and 14 daily periods, with historical consumption kept for every rate.

Where the meters sit matters as much as what they measure. On most sites the answer splits into four layers.

Where
Device
What it answers
Incoming supply
APM521 panel meter, or ADW300A where a DIN-rail fit is needed
The site total, its demand and its power quality
Branch feeders
ADL400M three-phase meter
Which feeder is holding the peak
Circuits that cannot be cabled
ADW300A wireless meter
The feeder an RS485 run cannot reach
Record and warning
Acrel IoT EMS cloud platform
One demand timeline, and the alarm to a named person

A meter that is only read after the bill arrives is an accounting tool. A meter whose reading is watched while the window is open is a control tool — and the two cost the same to install.
DP-04-meter
04 · Load list

Which loads can actually be shed

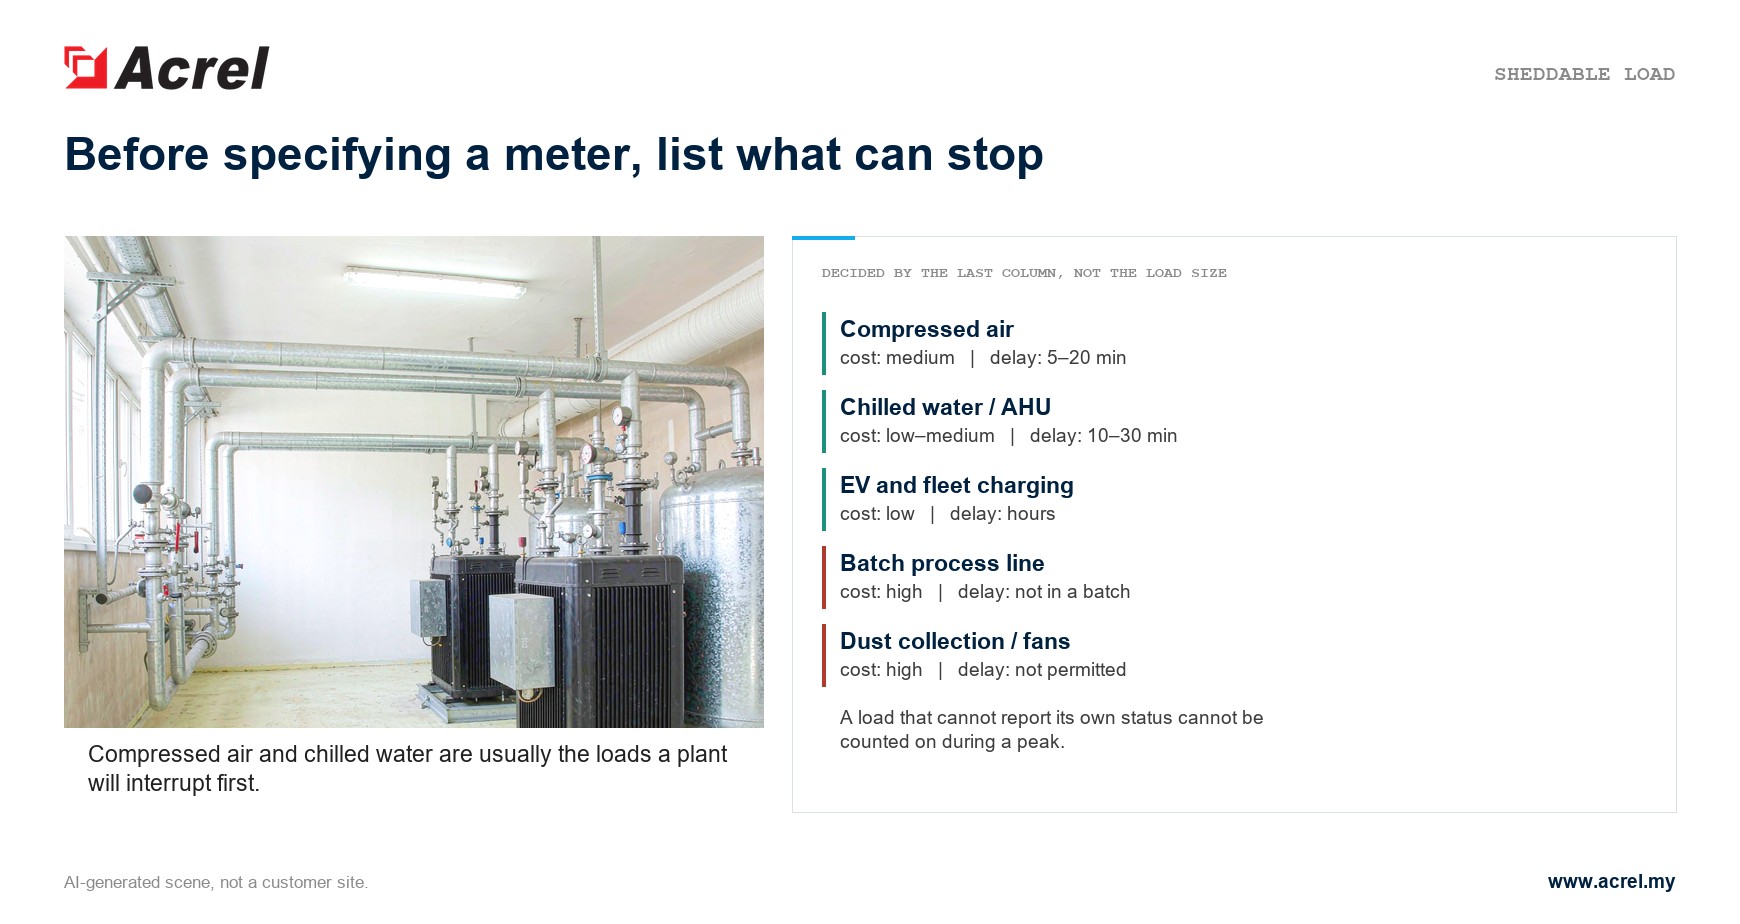
A warning is only useful if something can be done about it. Before any metering is specified, it is worth writing down which loads a facility is genuinely willing to interrupt, and for how long.

The useful measure is not how large the load is. It is the cost of interrupting it, multiplied by how long it can be delayed.

Load
Interruption cost
Can be delayed
Signal needed
Chilled water and AHU
low – medium
10–30 min, staged
run status + enable
Compressed air
medium
5–20 min, with receiver
pressure + run status
Batch process line
high
not during a batch
batch state
EV and fleet charging
low
hours, freely
charger status
Dust collection and fans
high
not permitted
interlock state
Non-process lighting and pumps
low
30 min or more
schedule

The last column is the one that decides the project. A load that cannot report its own status cannot be counted on during a peak, and a control scheme built on assumptions about machine state will eventually trip production instead of a compressor.
DP-05-loads
05 · Response

Deciding before the spike, not after the bill

Three things have to exist before a peak can be caught.
A warning line
Set it below the record the site already carries. A margin of roughly 10 % leaves room to react without trimming normal production: on a site holding 600 kW, an alarm at about 540 kW, not at 600 kW. That 60 kW of headroom is worth about RM5,800 a month on a time-of-use account.
A named person, and a listed action
Shedding a load requires somebody authorised to do it during that half-hour. A procedure that ends in a meeting is not a procedure.
Staggered starts
Most peaks are not one large load. They are two or three medium loads that overlap — a second compressor following a chiller start inside the same window. Separating them by fifteen minutes costs nothing.
DP-06-response
06 · First month

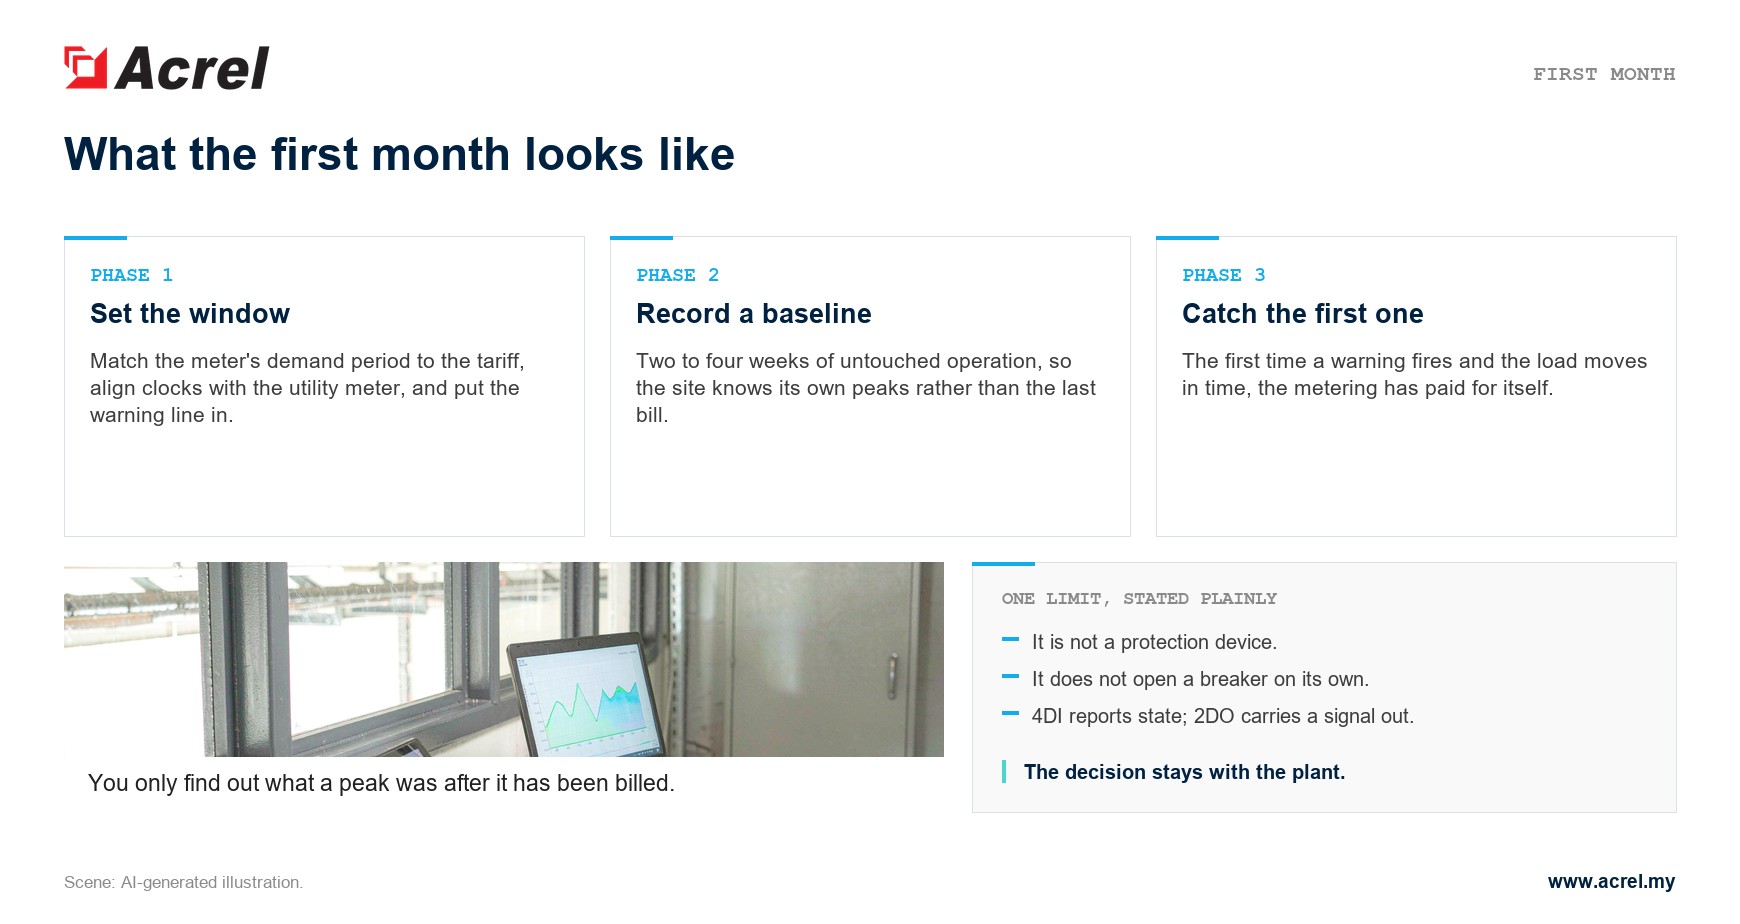
What the first month looks like

Phase 1
Set the window
Match the meter’s demand period to the tariff, align clocks with the utility meter, and put the warning line in.
Phase 2
Record a baseline
Two to four weeks of normal operation, untouched, so the site knows what its own peaks look like rather than what the last bill said.
Phase 3
Catch the first one
The first time a warning fires and the load moves before the window closes, the metering has paid for itself on that event alone.

One limit is worth stating plainly. ADW300A is a metering and recording instrument, not a protection device, and it does not open a breaker on its own. Its digital inputs report machine state and its digital outputs carry a signal to the control system the site already has. The decision stays with the plant; the meter makes sure the decision is made in time.

07 · Questions

Questions we are asked

Q: Can the meter cut the load automatically?
No. ADW300A measures, records and reports demand, and its 4DI / 2DO can carry a signal to an existing control system. Automatic load shedding is a control-system function, and it should be designed around loads the plant has already agreed to interrupt.
Q: Do we have to replace the utility meter?
No. The TNB revenue meter and the electricity bill remain the only official billing reference. ADW300A is an internal monitoring instrument, and its job is to explain the bill, not to replace it.
Q: Can the demand period really be set to 30 minutes?
Yes — the demand cycle is settable for site-side monitoring. Before comparing internal readings with the utility meter, align the clocks, the demand setting and the measurement boundary.
Q: We already have one incoming meter. Is that not enough?
It can prove a peak happened and record when. It cannot separate the chiller from the compressed air from the production line, so it cannot tell you which circuit to act on. That is what feeder-level sub-metering is for.
Q: Where should the first meters go?
On the incoming supply and on the three to five loads that set the peak — normally the chillers, the compressed air plant, the main production lines and any large intermittent load. Start from what the site is willing to shed, not from what is easiest to reach. The incomer usually takes a panel meter, the branch feeders take three-phase meters, and circuits that cannot be cabled take the wireless version.
Next step
Send the facility type, the incoming current and the loads you are willing to interrupt.
We will come back with the metering points, the CT sizes, and the warning settings to match your tariff.

Post time: Sep-28-2026