

How Sub-Metering Prepares Factory Energy Data for Carbon Reporting
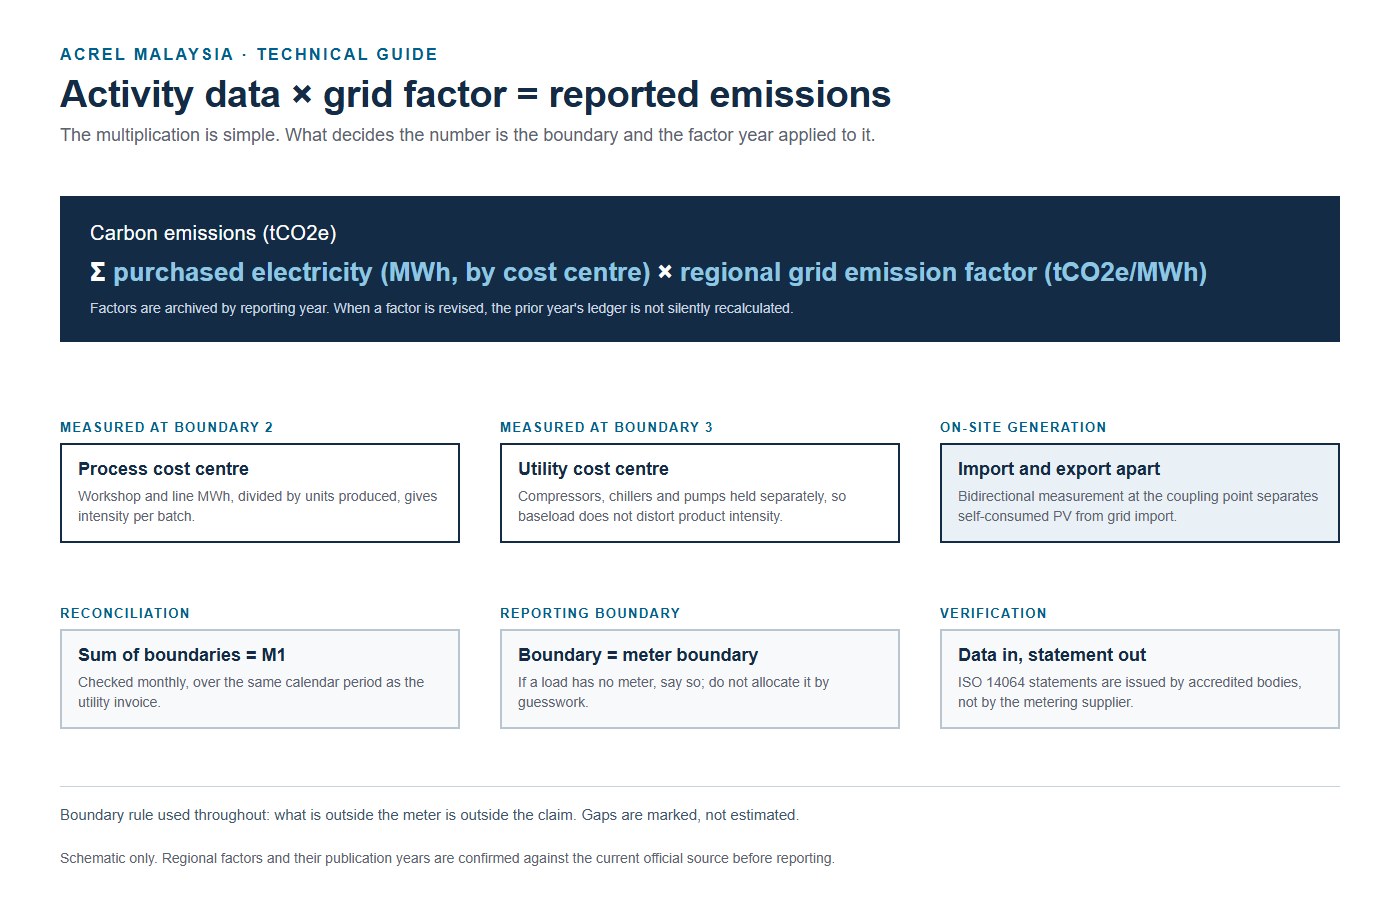
In corporate sustainability reporting, emissions from purchased electricity are an electrical measurement problem before they are an accounting one. Under the GHG Protocol and Malaysia’s National Sustainability Reporting Framework (NSRF), Scope 2 covers the indirect emissions from the power a facility buys. The arithmetic is one multiplication: megawatt-hours purchased × the regional grid emission factor = tonnes of CO2 equivalent.
The equation is simple. The measurement is not. A factory does not draw power as one uniform block — it flows at the same time into production machinery, environmental controls, utility plant and administration. Sub-metering is what connects the distribution board to the carbon ledger.
1. Why the utility invoice leaves a gap
A monthly TNB statement records the energy that entered the main substation transformer. As the financial benchmark for total site consumption, that figure is authoritative. It cannot separate process load from facility overhead.
When a customer asks for the carbon intensity of one product line, dividing total site emissions by total output misstates it. Energy-intensive processes get subsidised by lighter assembly work, and continuous loads — cleanroom ventilation, chilled water — pull unit intensity around whenever production volume falls. Sub-metering makes the fixed baseload visible, so it can be reported separately instead of spread across every product.
2. Structuring the metering boundaries
Standard practice does not put a meter on every branch circuit. Three functional boundaries cover most industrial sites:
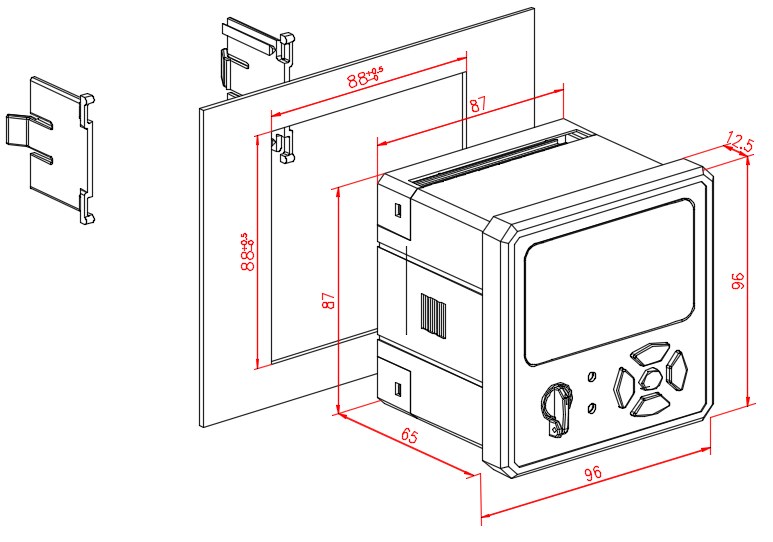
- Main incoming verification — at the LV main switchboard (MSB) incomer. The AEM96 measures active and reactive energy with individual harmonic analysis from the 2nd to the 63rd order. The purpose of this meter is reconciliation: plant data has to agree with the utility invoice.
- Workshop and process distribution — at secondary boards feeding a workshop, a CNC cluster or an assembly cell. Active energy plus operating hours, so consumption maps onto a production batch.
- Central utility loops — dedicated feeders for screw compressors, chilled water plant and cooling water pumps. In many plants these account for 30–50% of electricity, and they run regardless of the production schedule.
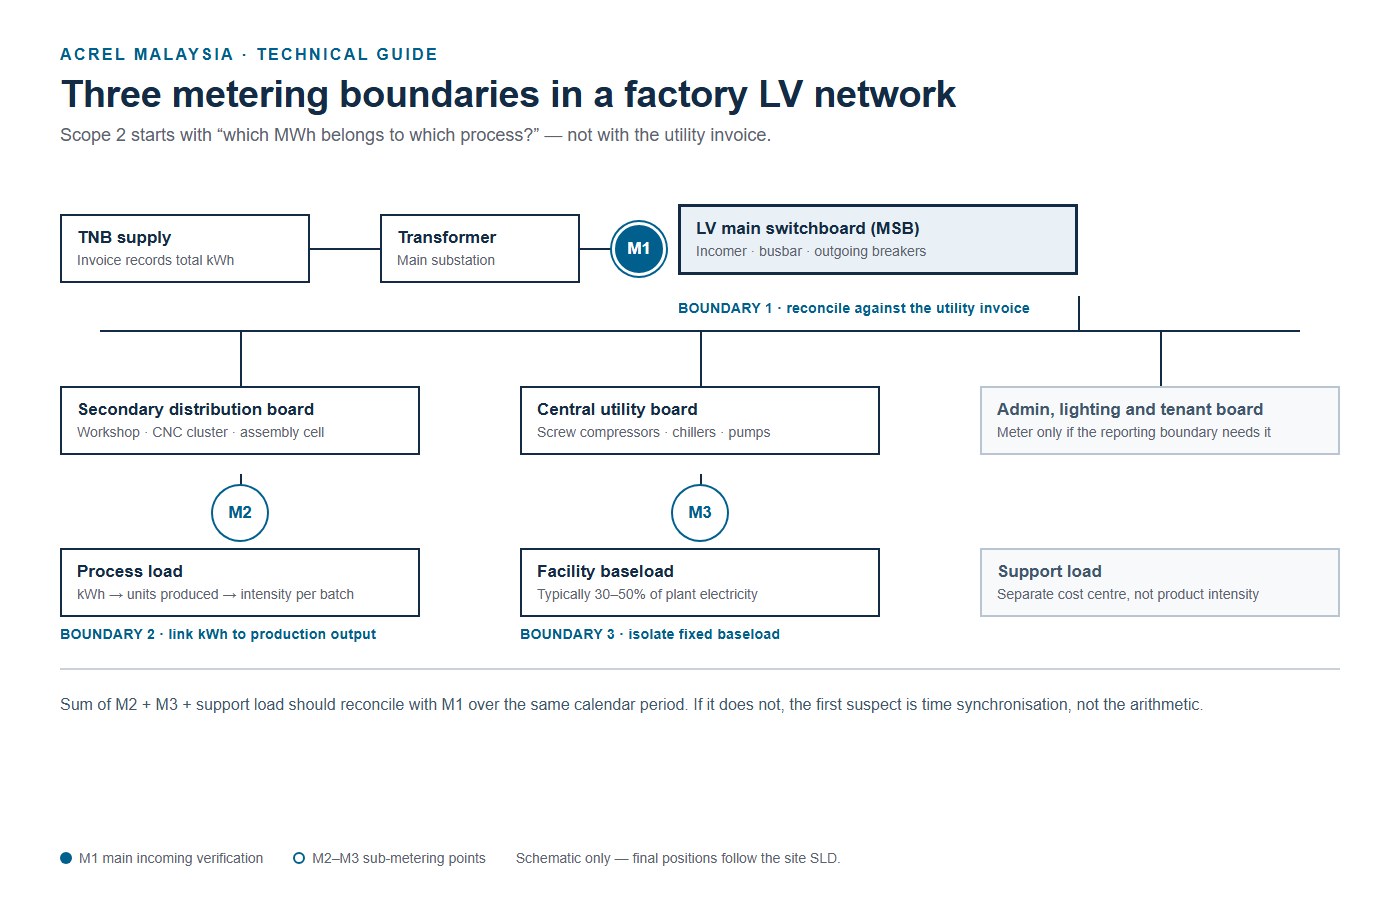
Figure 1. Three metering boundaries in a factory LV network. Schematic only — final positions follow the site single-line diagram.
| Boundary | Meter position | Question it answers |
|---|---|---|
| 1. Main incoming | LV main switchboard incomer | Does plant data reconcile with the utility invoice? |
| 2. Workshop and process | Secondary board, MCC or assembly cell | Which kWh belongs to which line or batch? |
| 3. Central utilities | Compressor, chiller and pump feeders | What is fixed facility baseload? |
3. Keeping the data consistent across communication loops
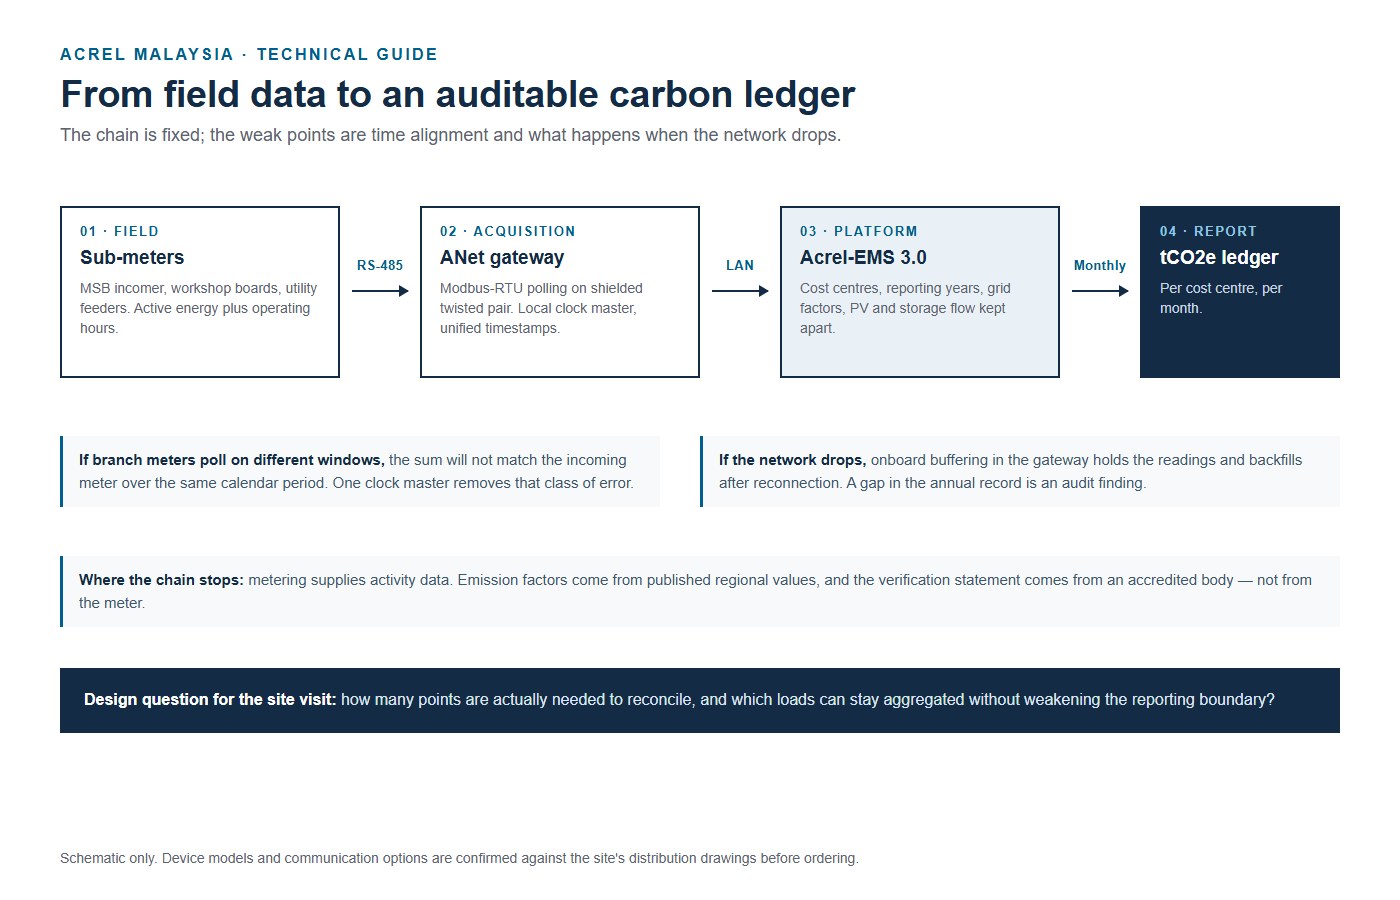
In a multi-circuit system, consistency depends on the polling interval. If branch meters log on different schedules or time windows, the sum of the branches will not match the incoming meter over the same calendar period — and the difference looks like an energy loss that nobody can explain.
Field instruments connect over shielded RS-485 Modbus-RTU loops to a communication gateway. The gateway acts as the local clock master, polls the meters on one schedule and timestamps every record. Onboard buffering holds readings through a network interruption and backfills afterwards, so the annual record stays continuous.
4. Compiling the carbon record
Converting kilowatt-hours into a compliant record means mapping activity data to published factors: tCO2e = Σ (purchased MWh × regional grid emission factor).
The platform keeps emission factors by reporting year, allocates consumption to cost centres, and — where the site runs rooftop PV or battery storage — measures bidirectional flow at the coupling point so self-consumed generation is not counted as grid import.
5. Practical first steps
Start with the single-line diagram. Mark the incoming breaker, the process boards and the utility feeders. That layout decides how many meters are needed and where they sit. Related field notes on maximum demand and interval data are collected in our technical news section.
Data quality depends on the instrument and the installation as much as on the software. CT ratio, phase assignment, wiring polarity and the meter’s own accuracy class all end up in the reported number.
Metering supplies the activity data. Emission factors come from published regional values, and verification statements come from accredited bodies — not from the meter.
If you are preparing a first carbon inventory and are not sure where the meters belong, send us the single-line diagram. We will mark the boundaries and the points to measure.
FAQ
Can we use the utility bill on its own?
For the total Scope 2 figure at site level, yes — the bill is the reference. It cannot support product-level intensity, cost-centre allocation or any claim about which process uses what.
Do we need a meter on every circuit?
No. Most plants need the incoming incomer, the main process boards and the central utility feeders. Add circuits when a reporting boundary or a cost centre depends on them.
Where does the emission factor come from?
From the published regional value for the reporting year. Factors are revised over time, so the ledger keeps the factor used for each year instead of recalculating history.
Post time: Nov-10-2026


